| HOME | ABOUT | RESEARCH | METEOROLOGY | PROJECTS | LINKS |
|
Data analysis, visualization, and science
|
| HOME | ABOUT | RESEARCH | METEOROLOGY | PROJECTS | LINKS |
|
Data analysis, visualization, and science
|
 |
|
|
||||||
|---|---|---|---|---|---|---|---|---|
|
|
|||||||
|
|
|||||||
|
||||||||
|
|
|||||||
|
|
|||||||
|
|
|||||||
|
|
|||||||
|
|
|||||||
|
||||||||
|
|
|||||||
|
|
|||||||

|
|
|||||||
|
|
|||||||
|
|
|||||||
|
||||||||
|
|
|||||||
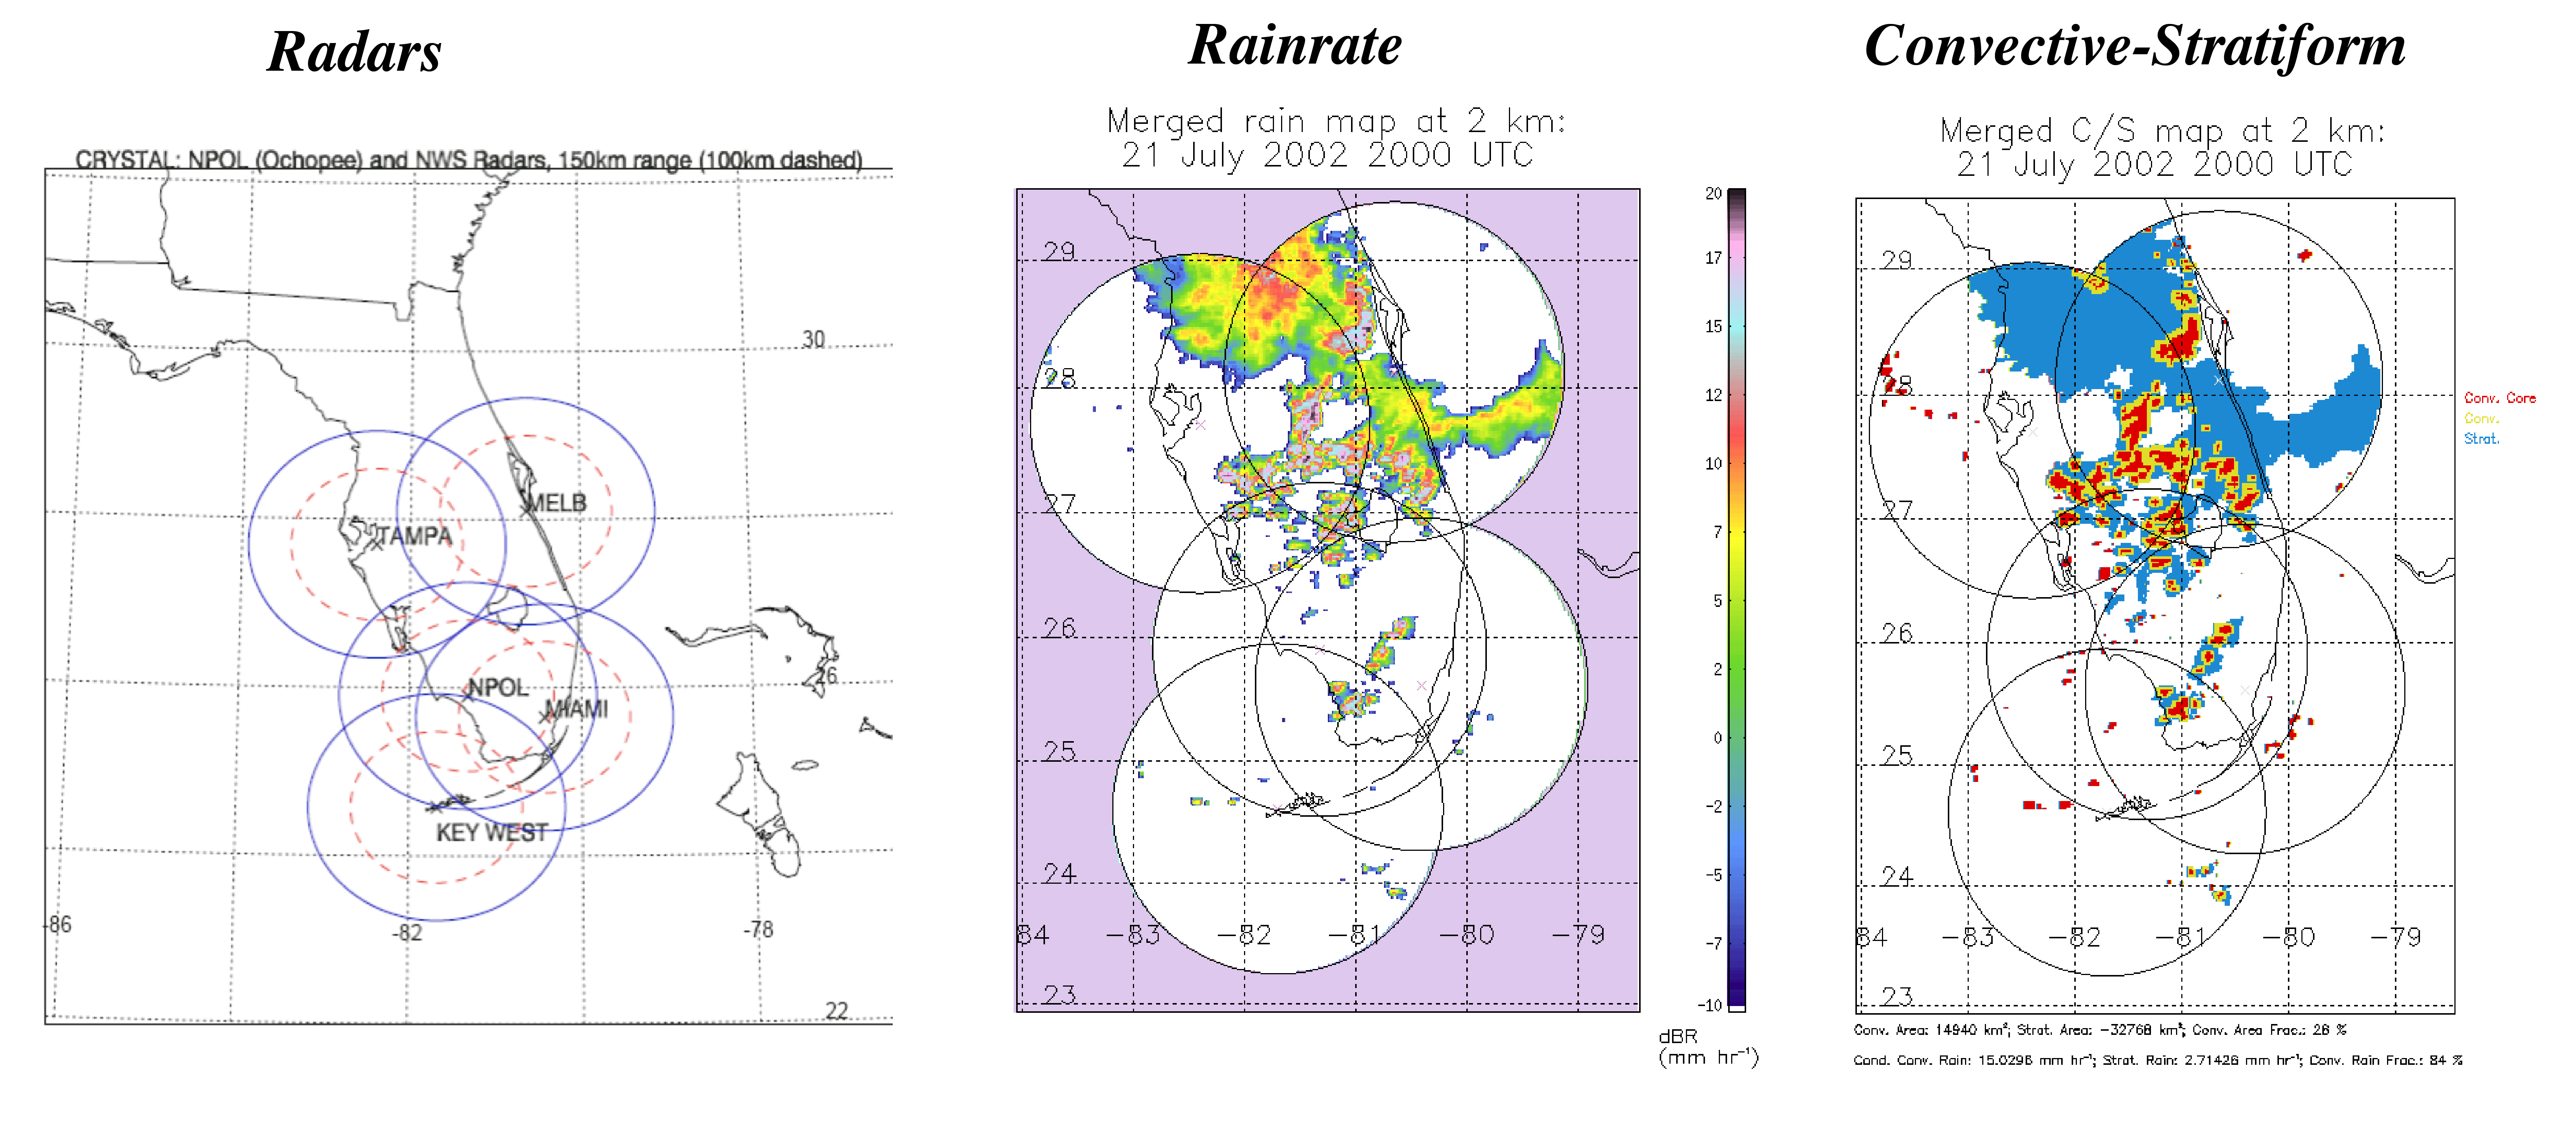
Analysis of Land vs. Ocean Radar-Derived South Florida Rainfall Data During NASA CRYSTAL-FACE
|

|
|||||||
|
|
|||||||
|
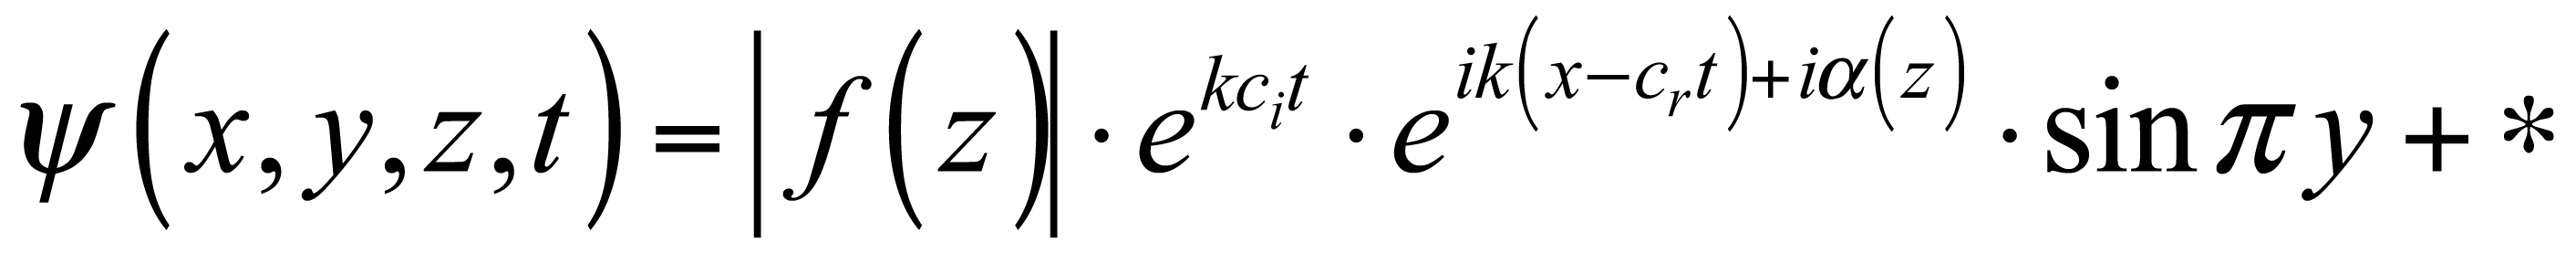
Planewave form of the geostrophic streamfunction 
|
|
|||||||
|
|
|||||||
|
|
|||||||
|
|
|||||||
|
|
|||||||
|
|
|
||
|
|||
| Top | pg. 2 | ||