- Data and figures: These are draft figures generated from the US CDC Vaccine Adverse Event Reporting System (VAERS) weekly data, and one from the EU EudraVigilance system. Please do not share this URL publicly. These figures and data are posted here to assist medical researchers, and are for informational purposes only. Nothing on this website should be seen or thought to represent medical advice. Please consult your doctor and/or local/national health authorities for medical advice.
Click images below, or links above, to open PDFs or interactive figures. Symbols (in most figures) link to their respective reports.
- VAERS data (gaps, limitations, and analysis)
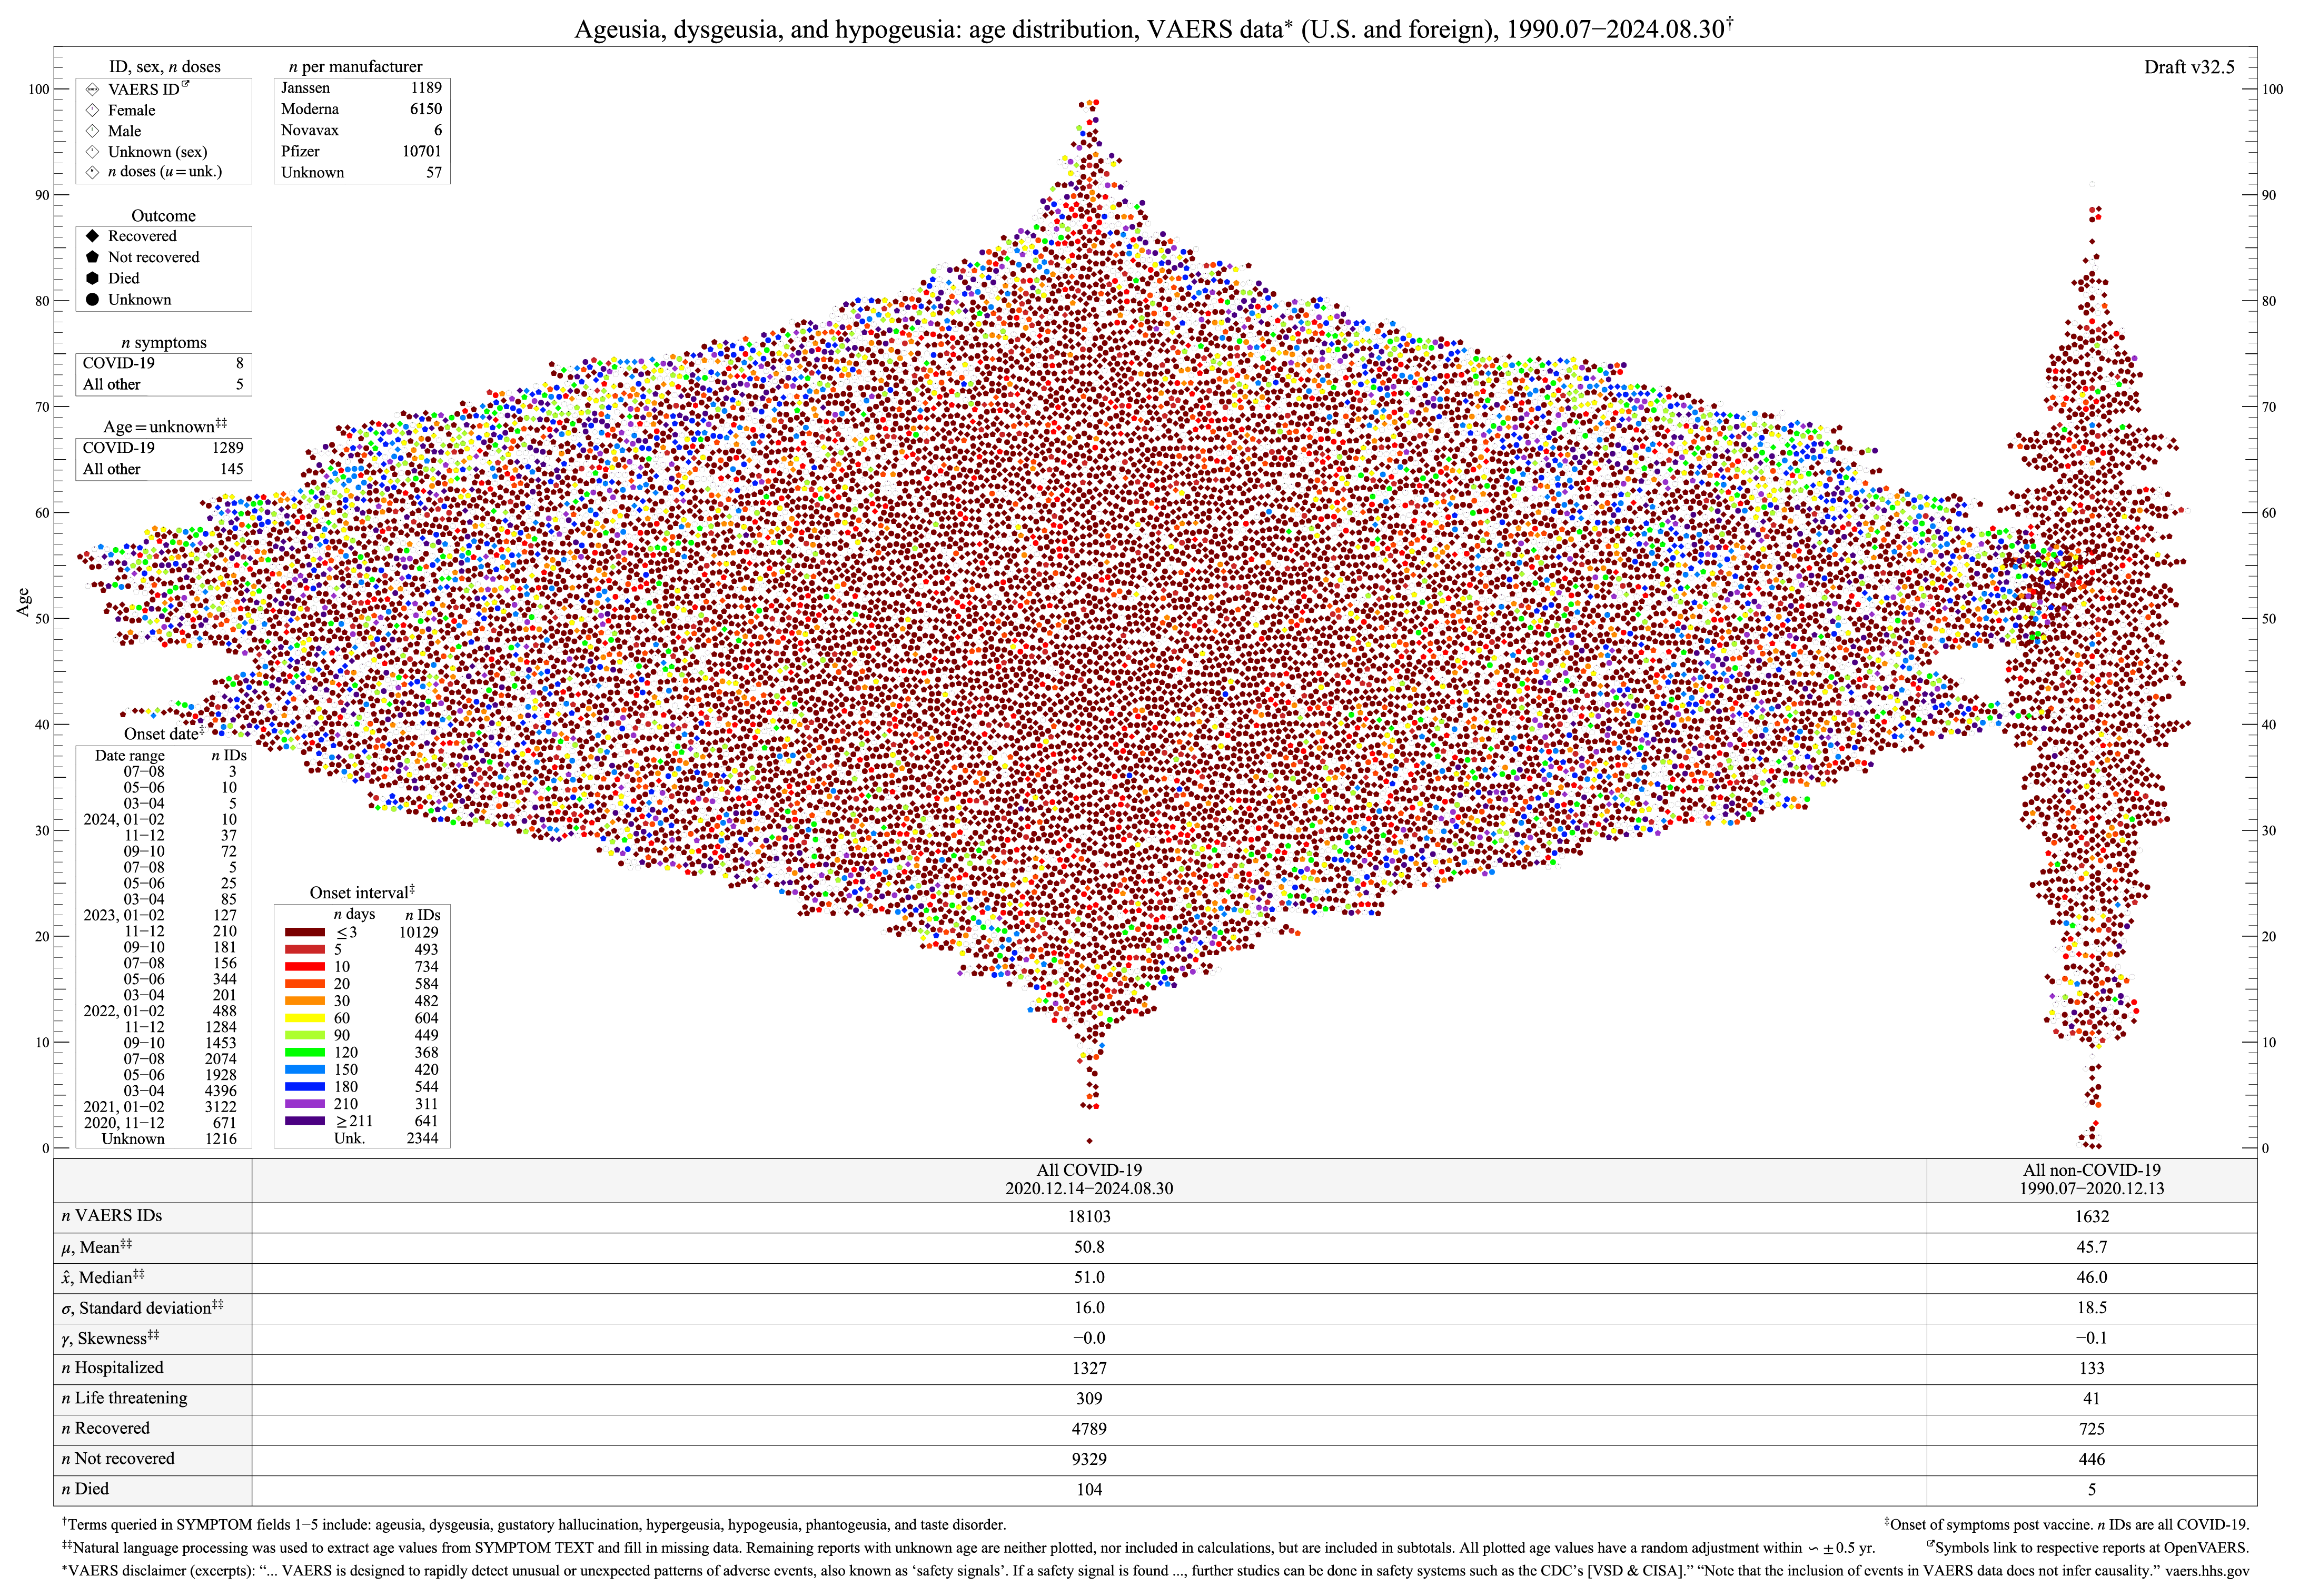
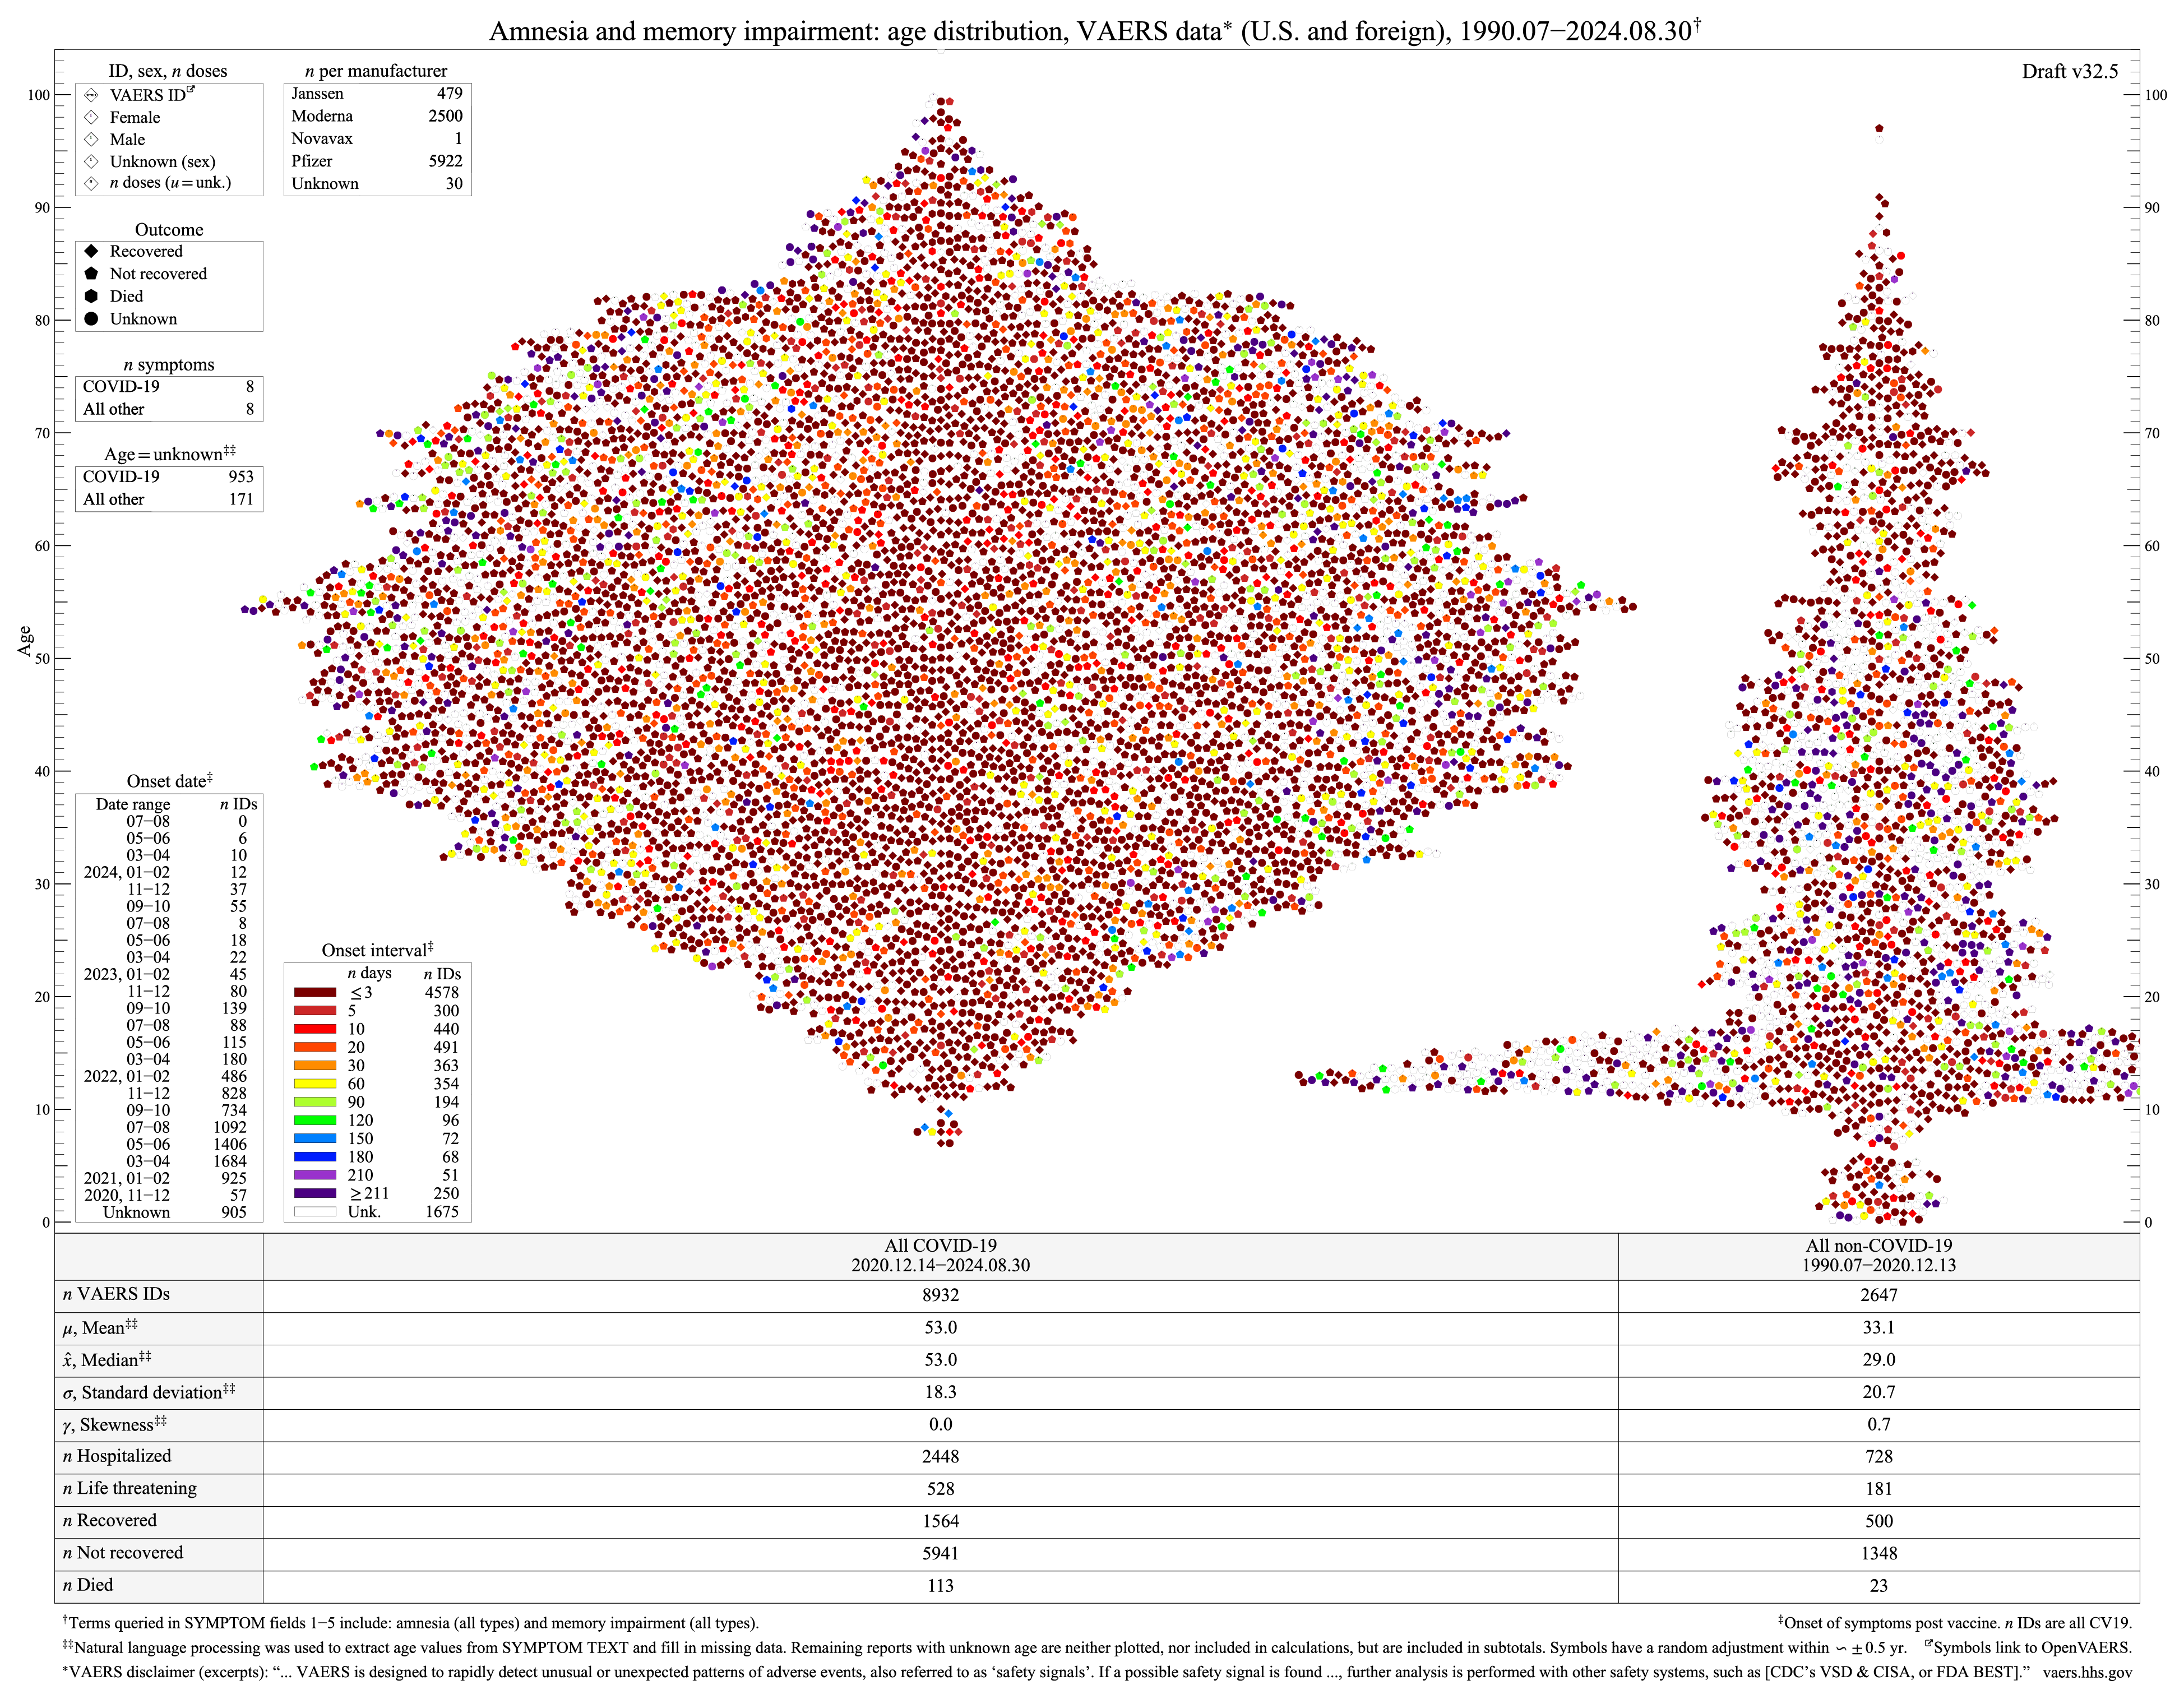
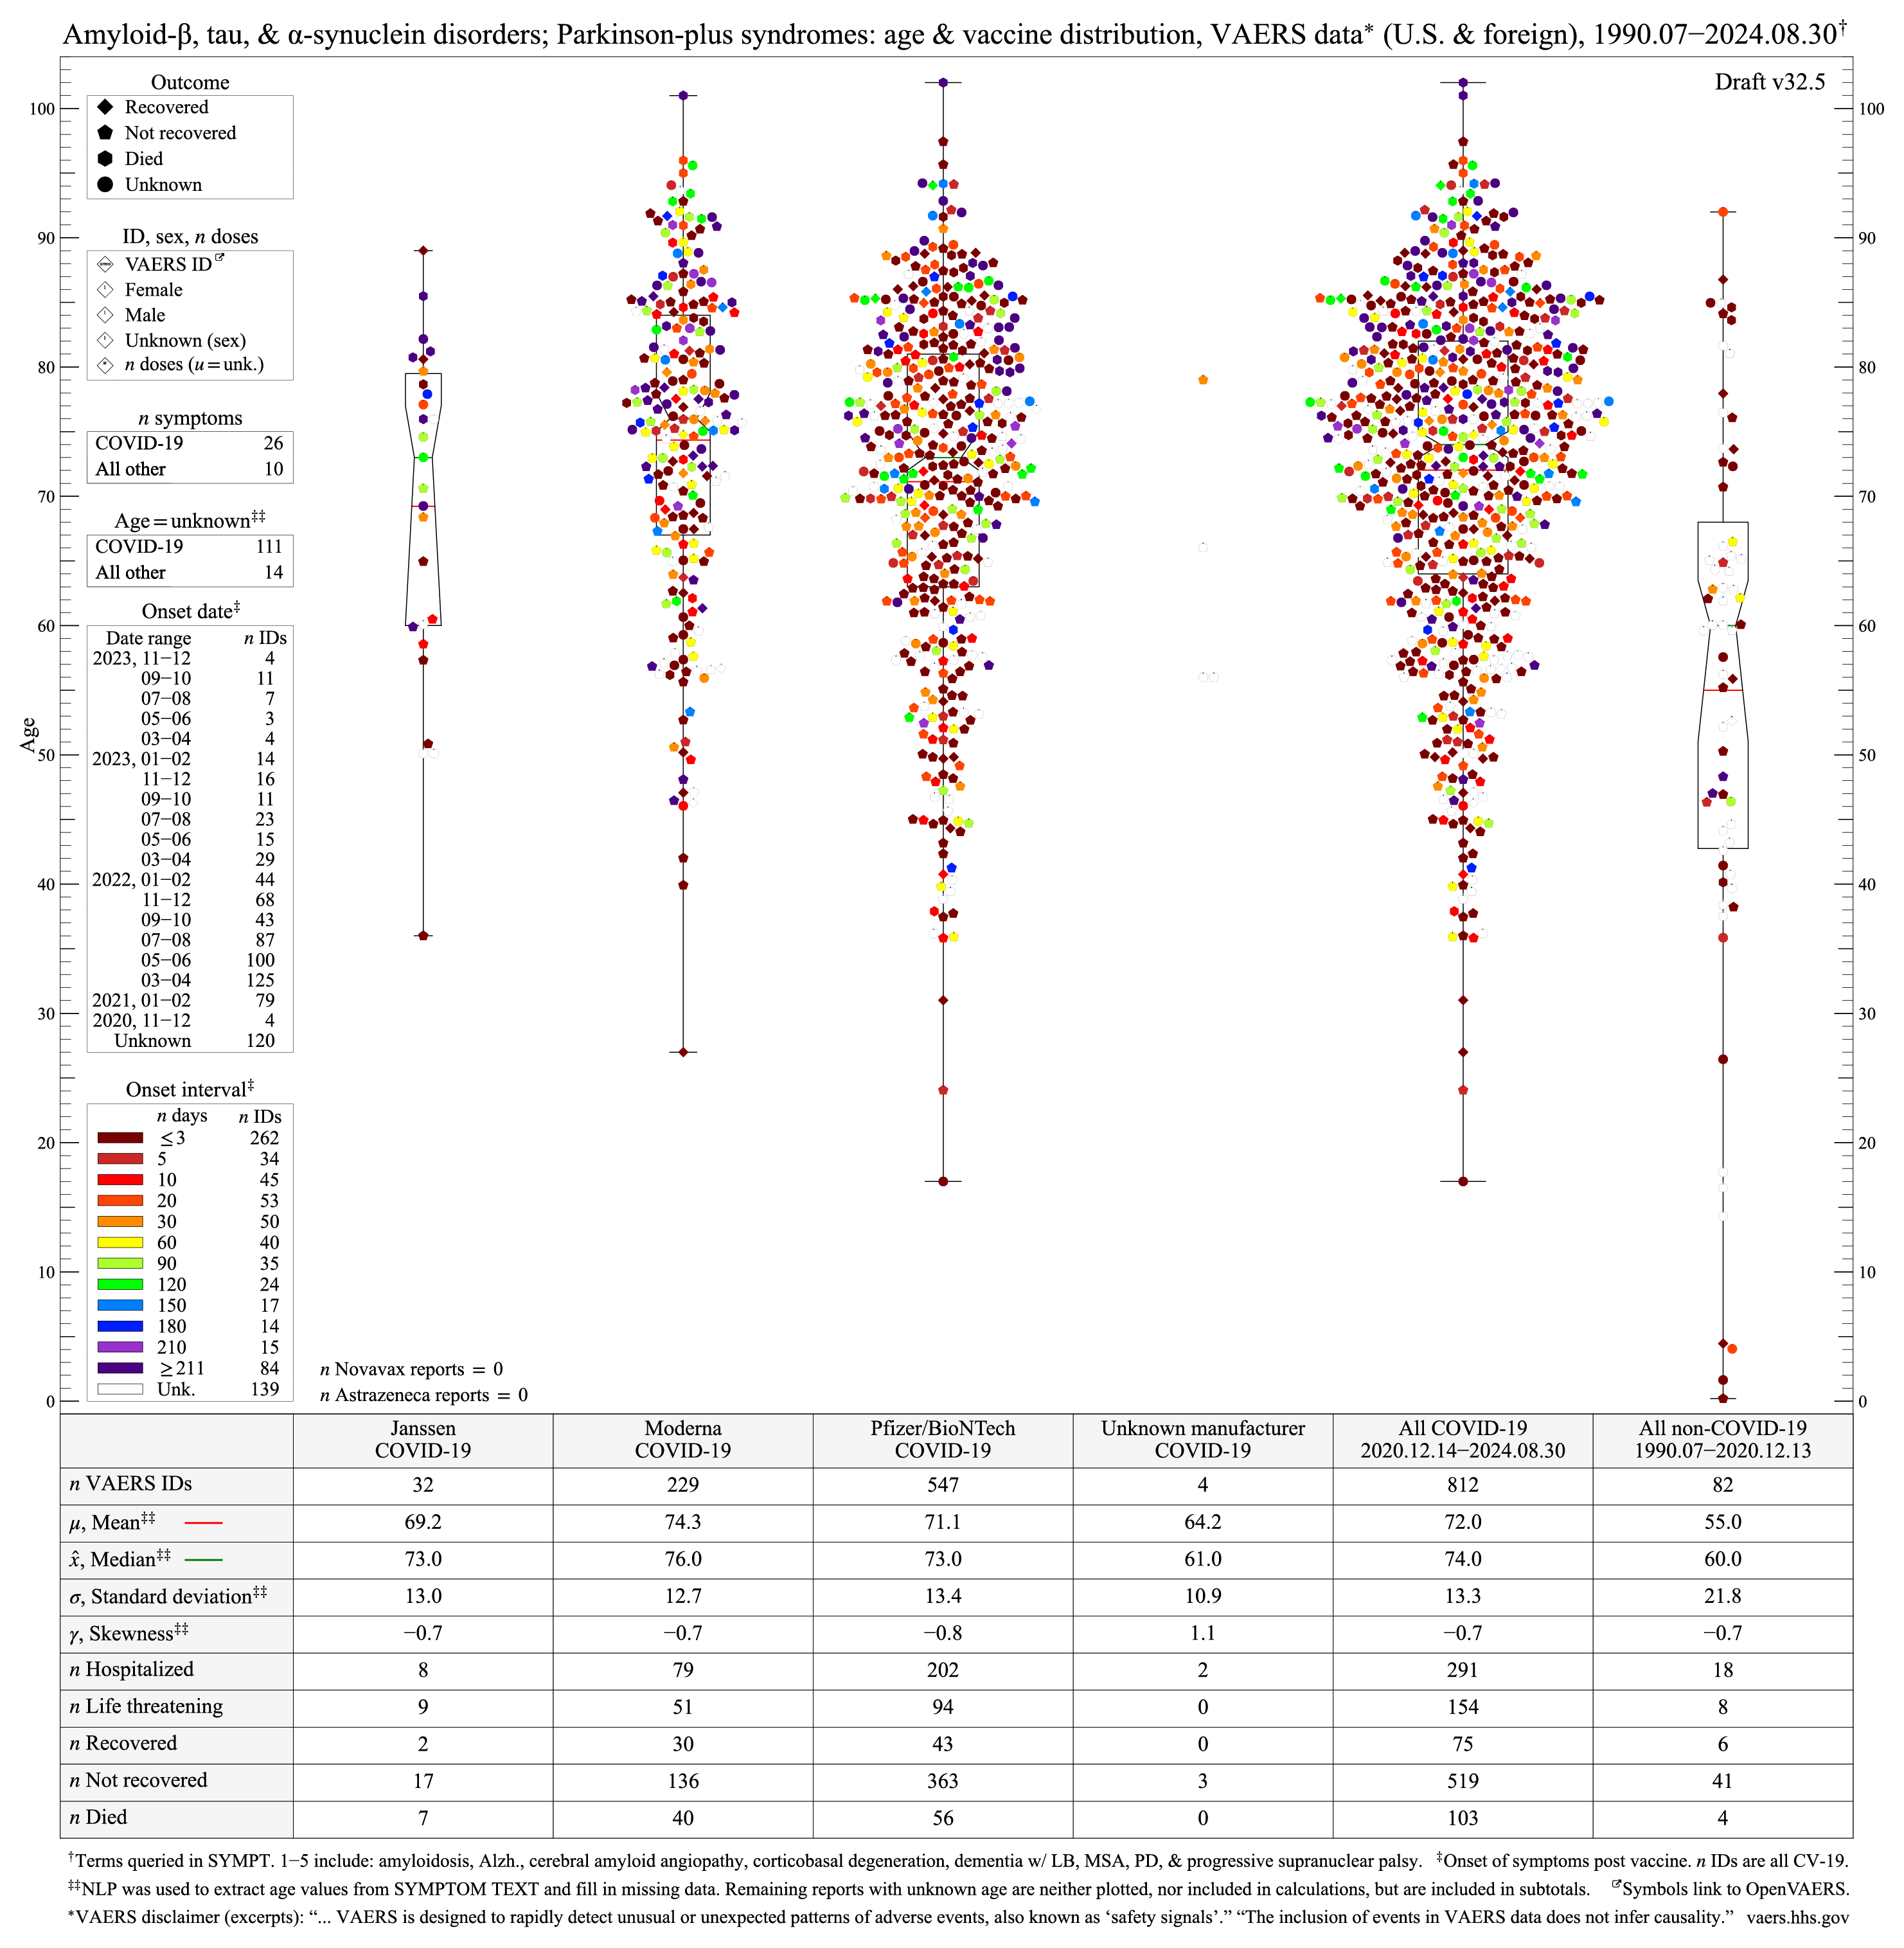
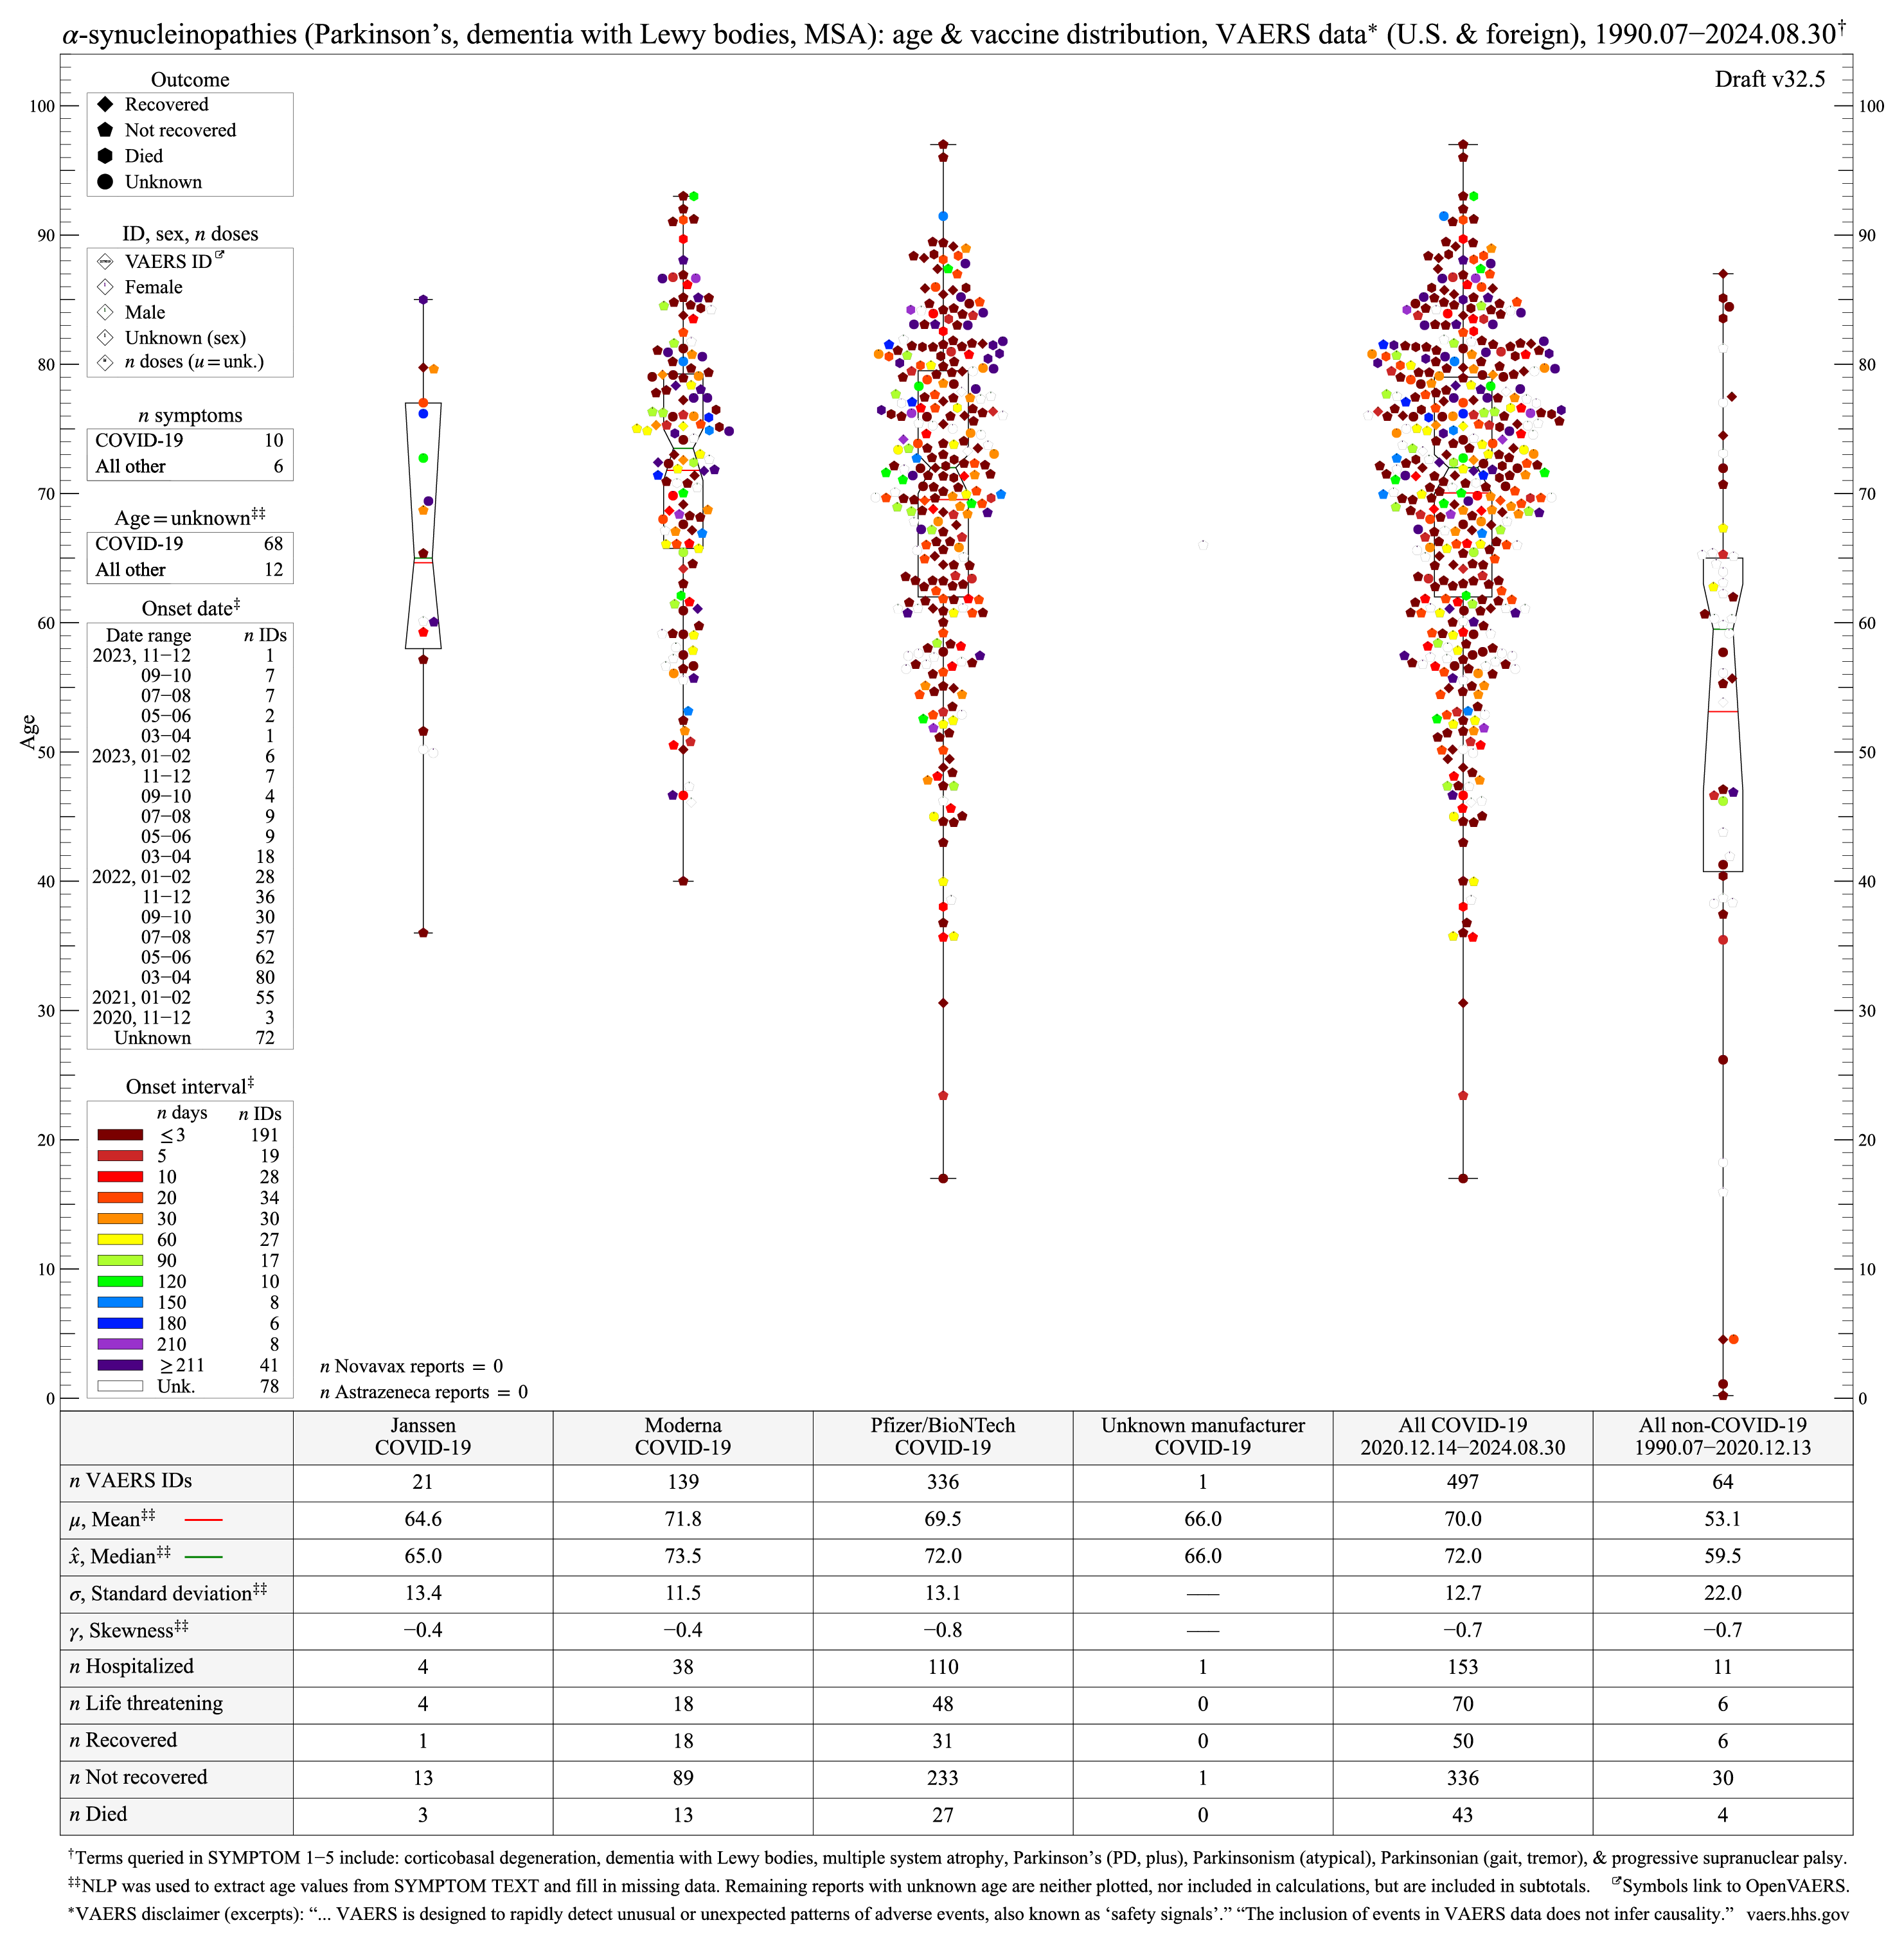
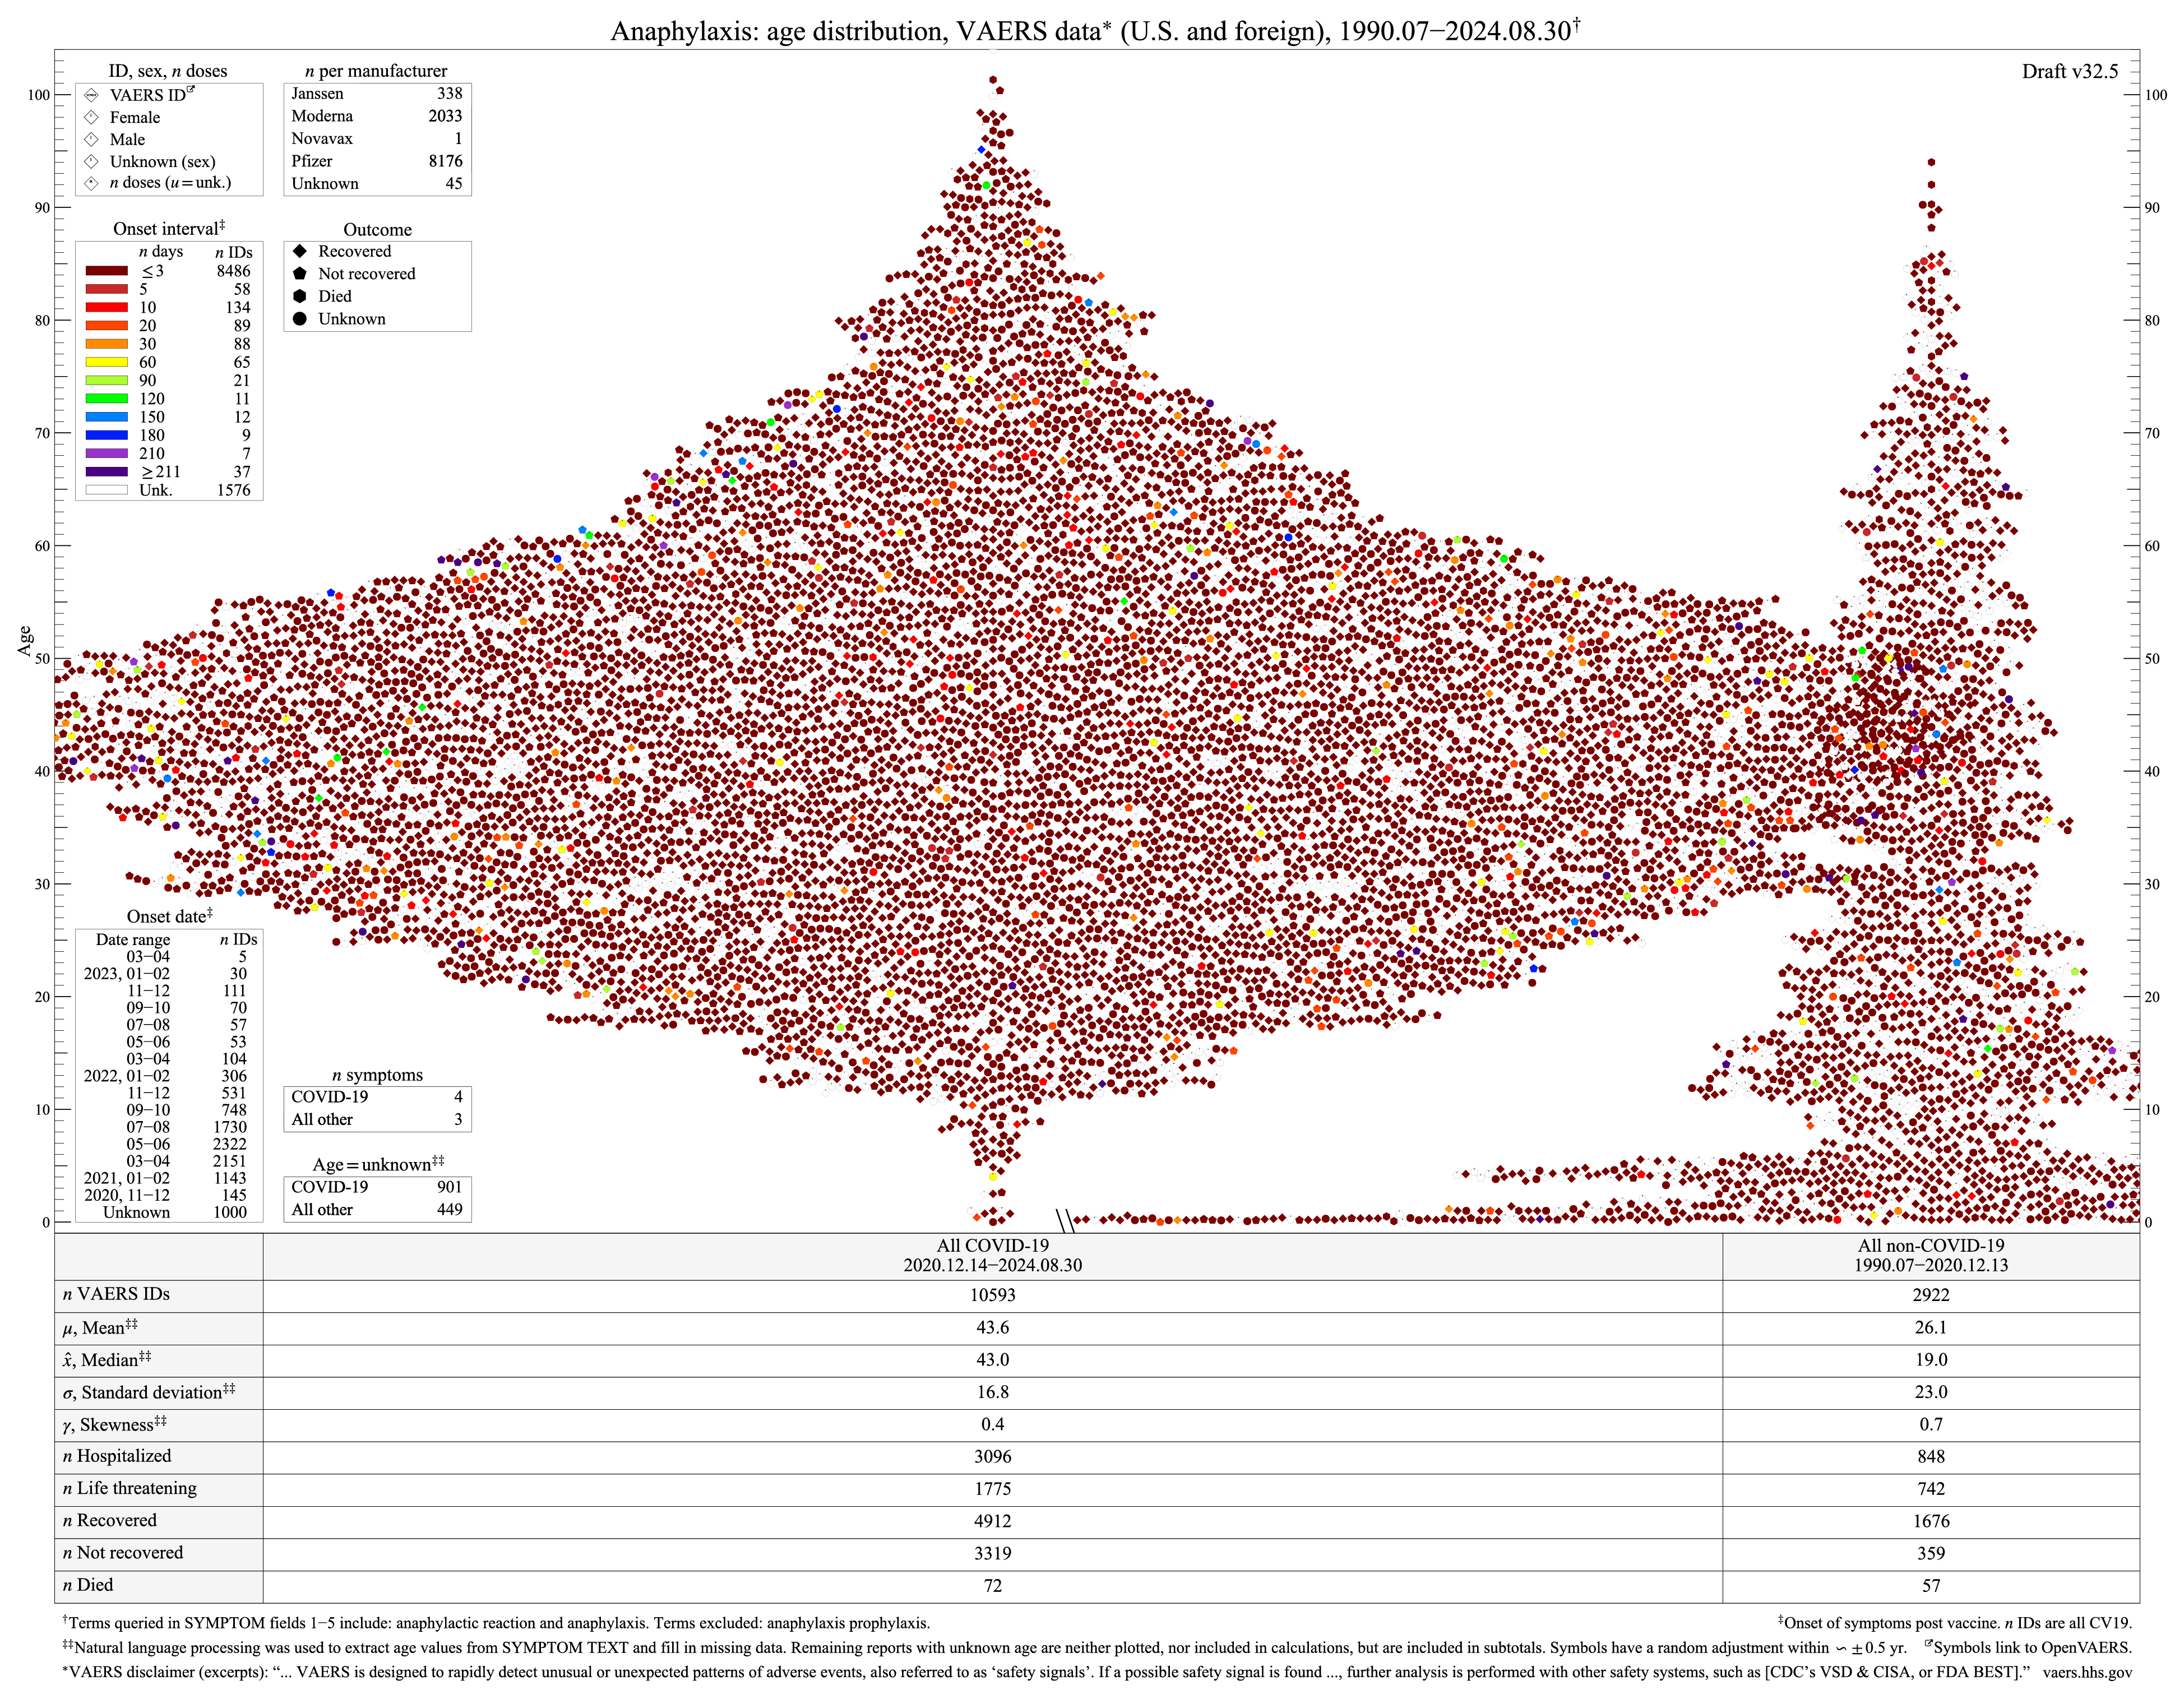
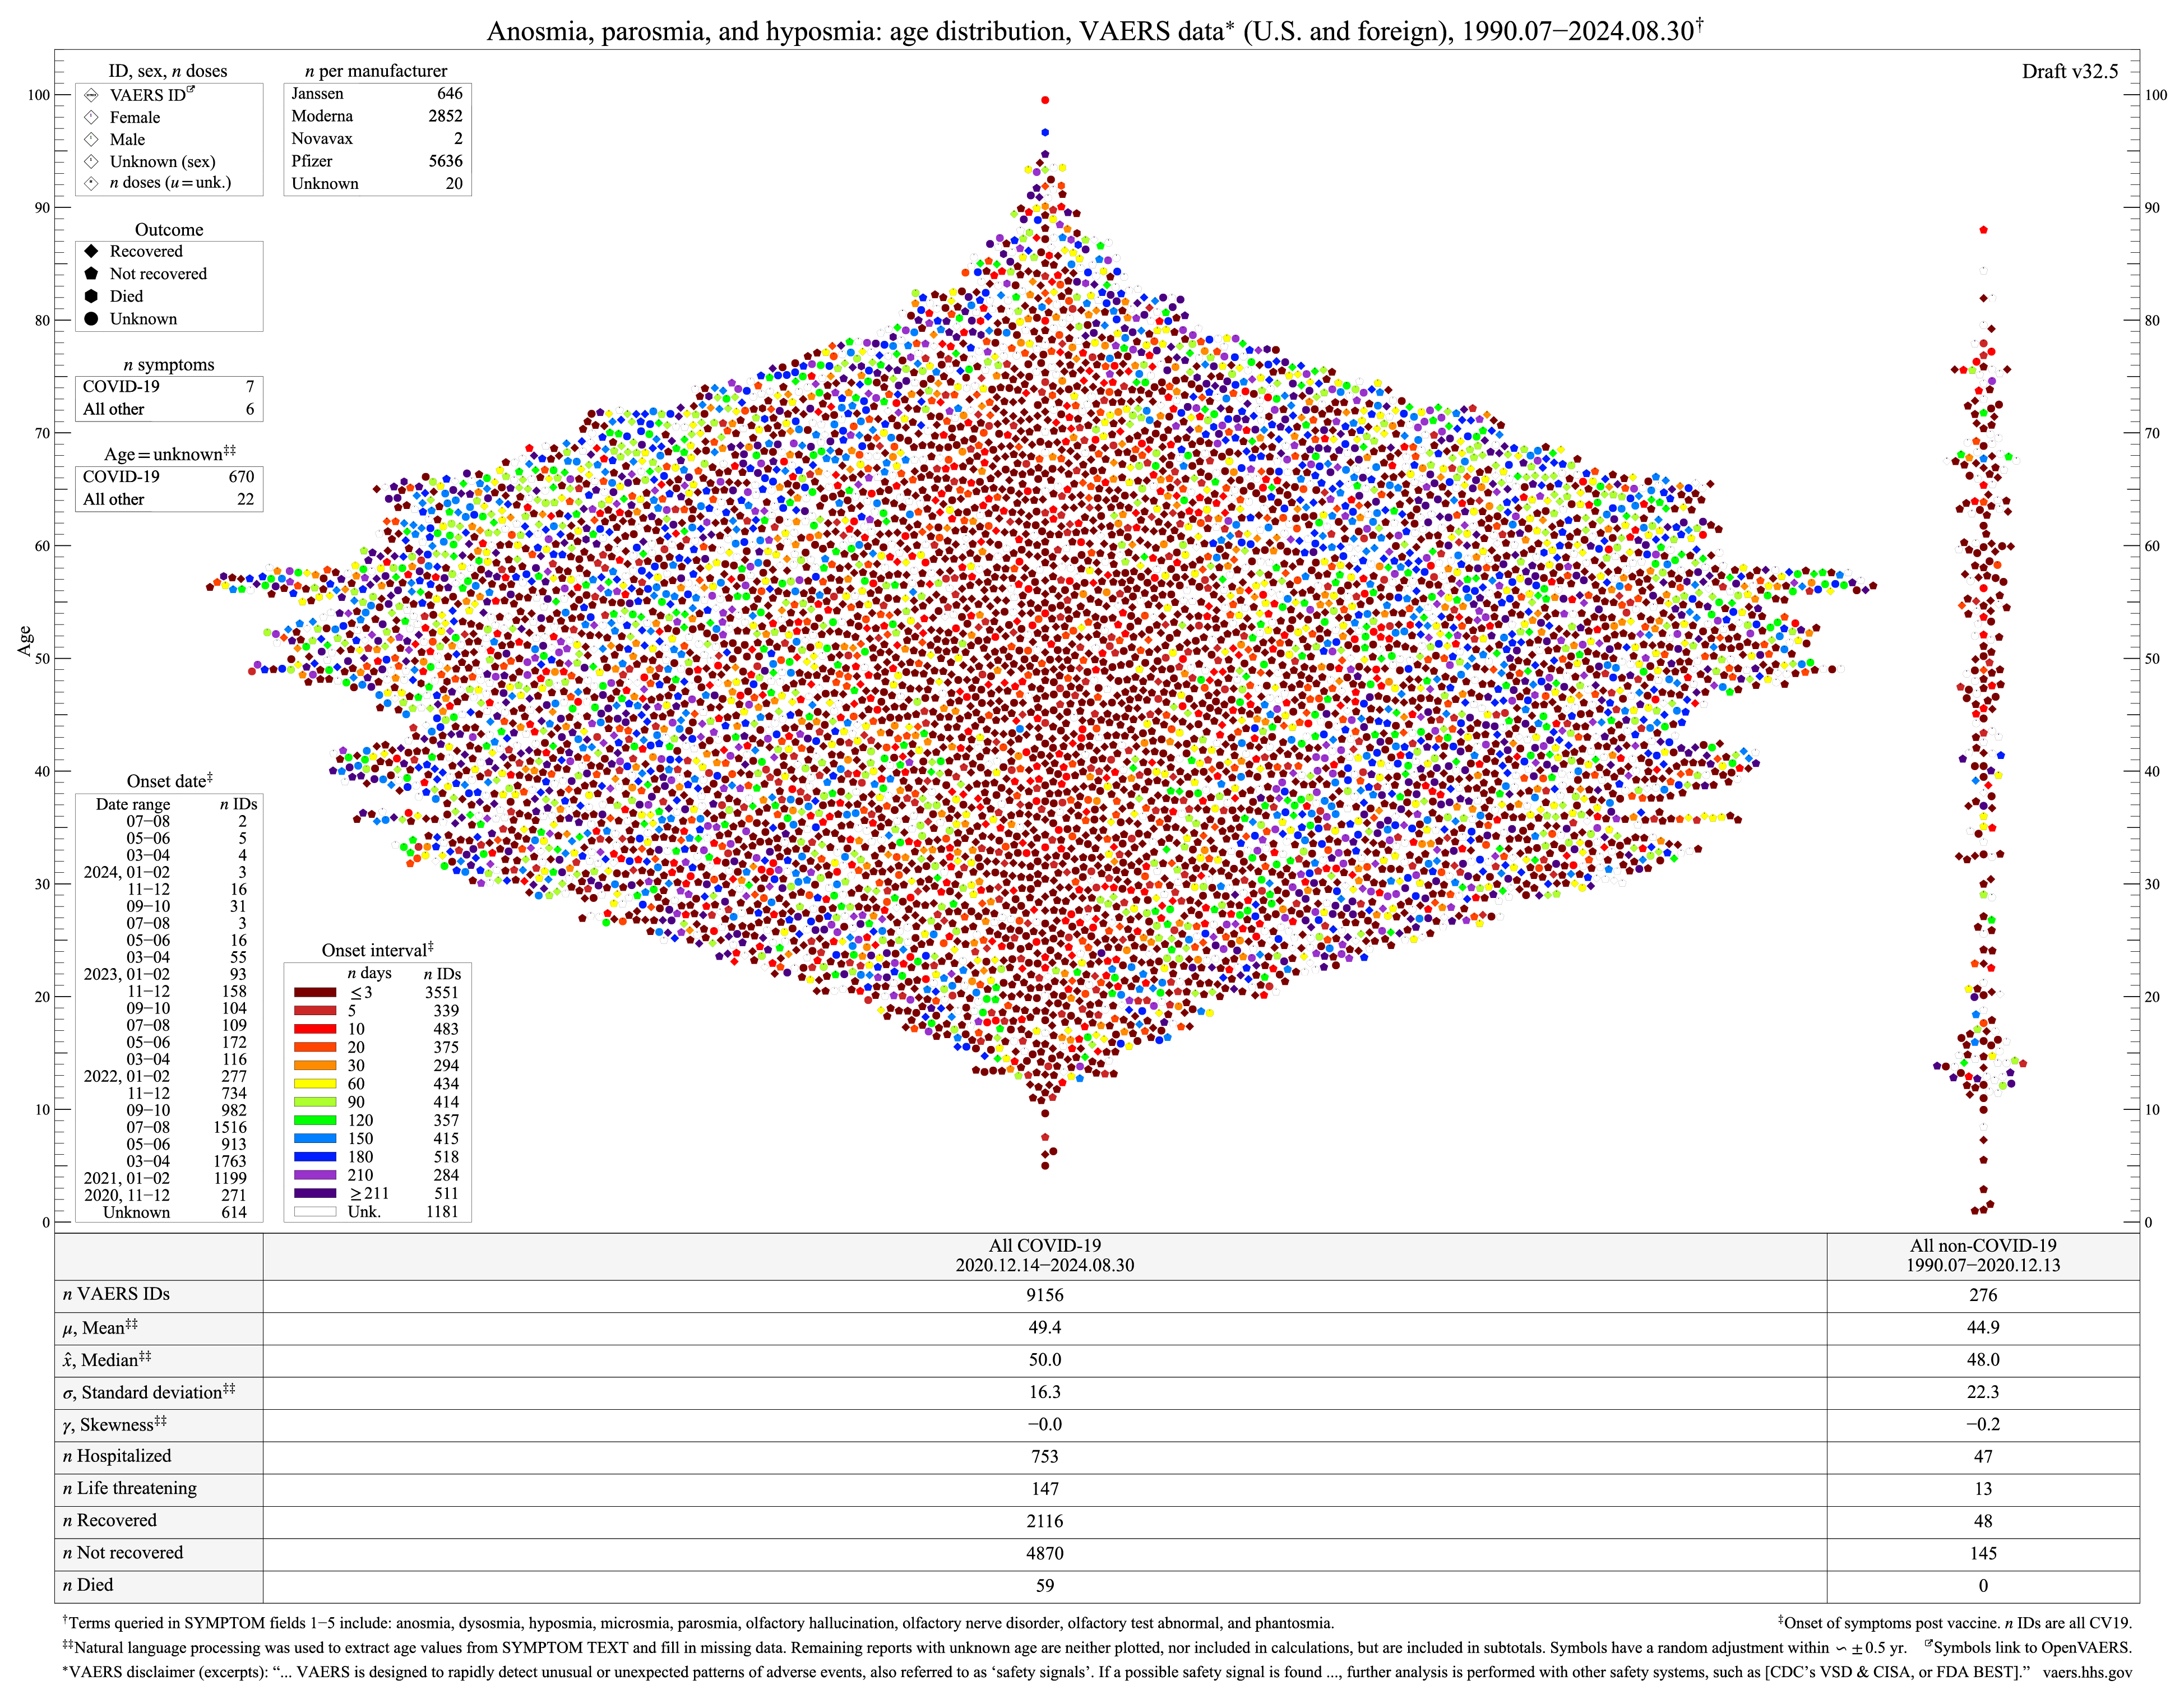
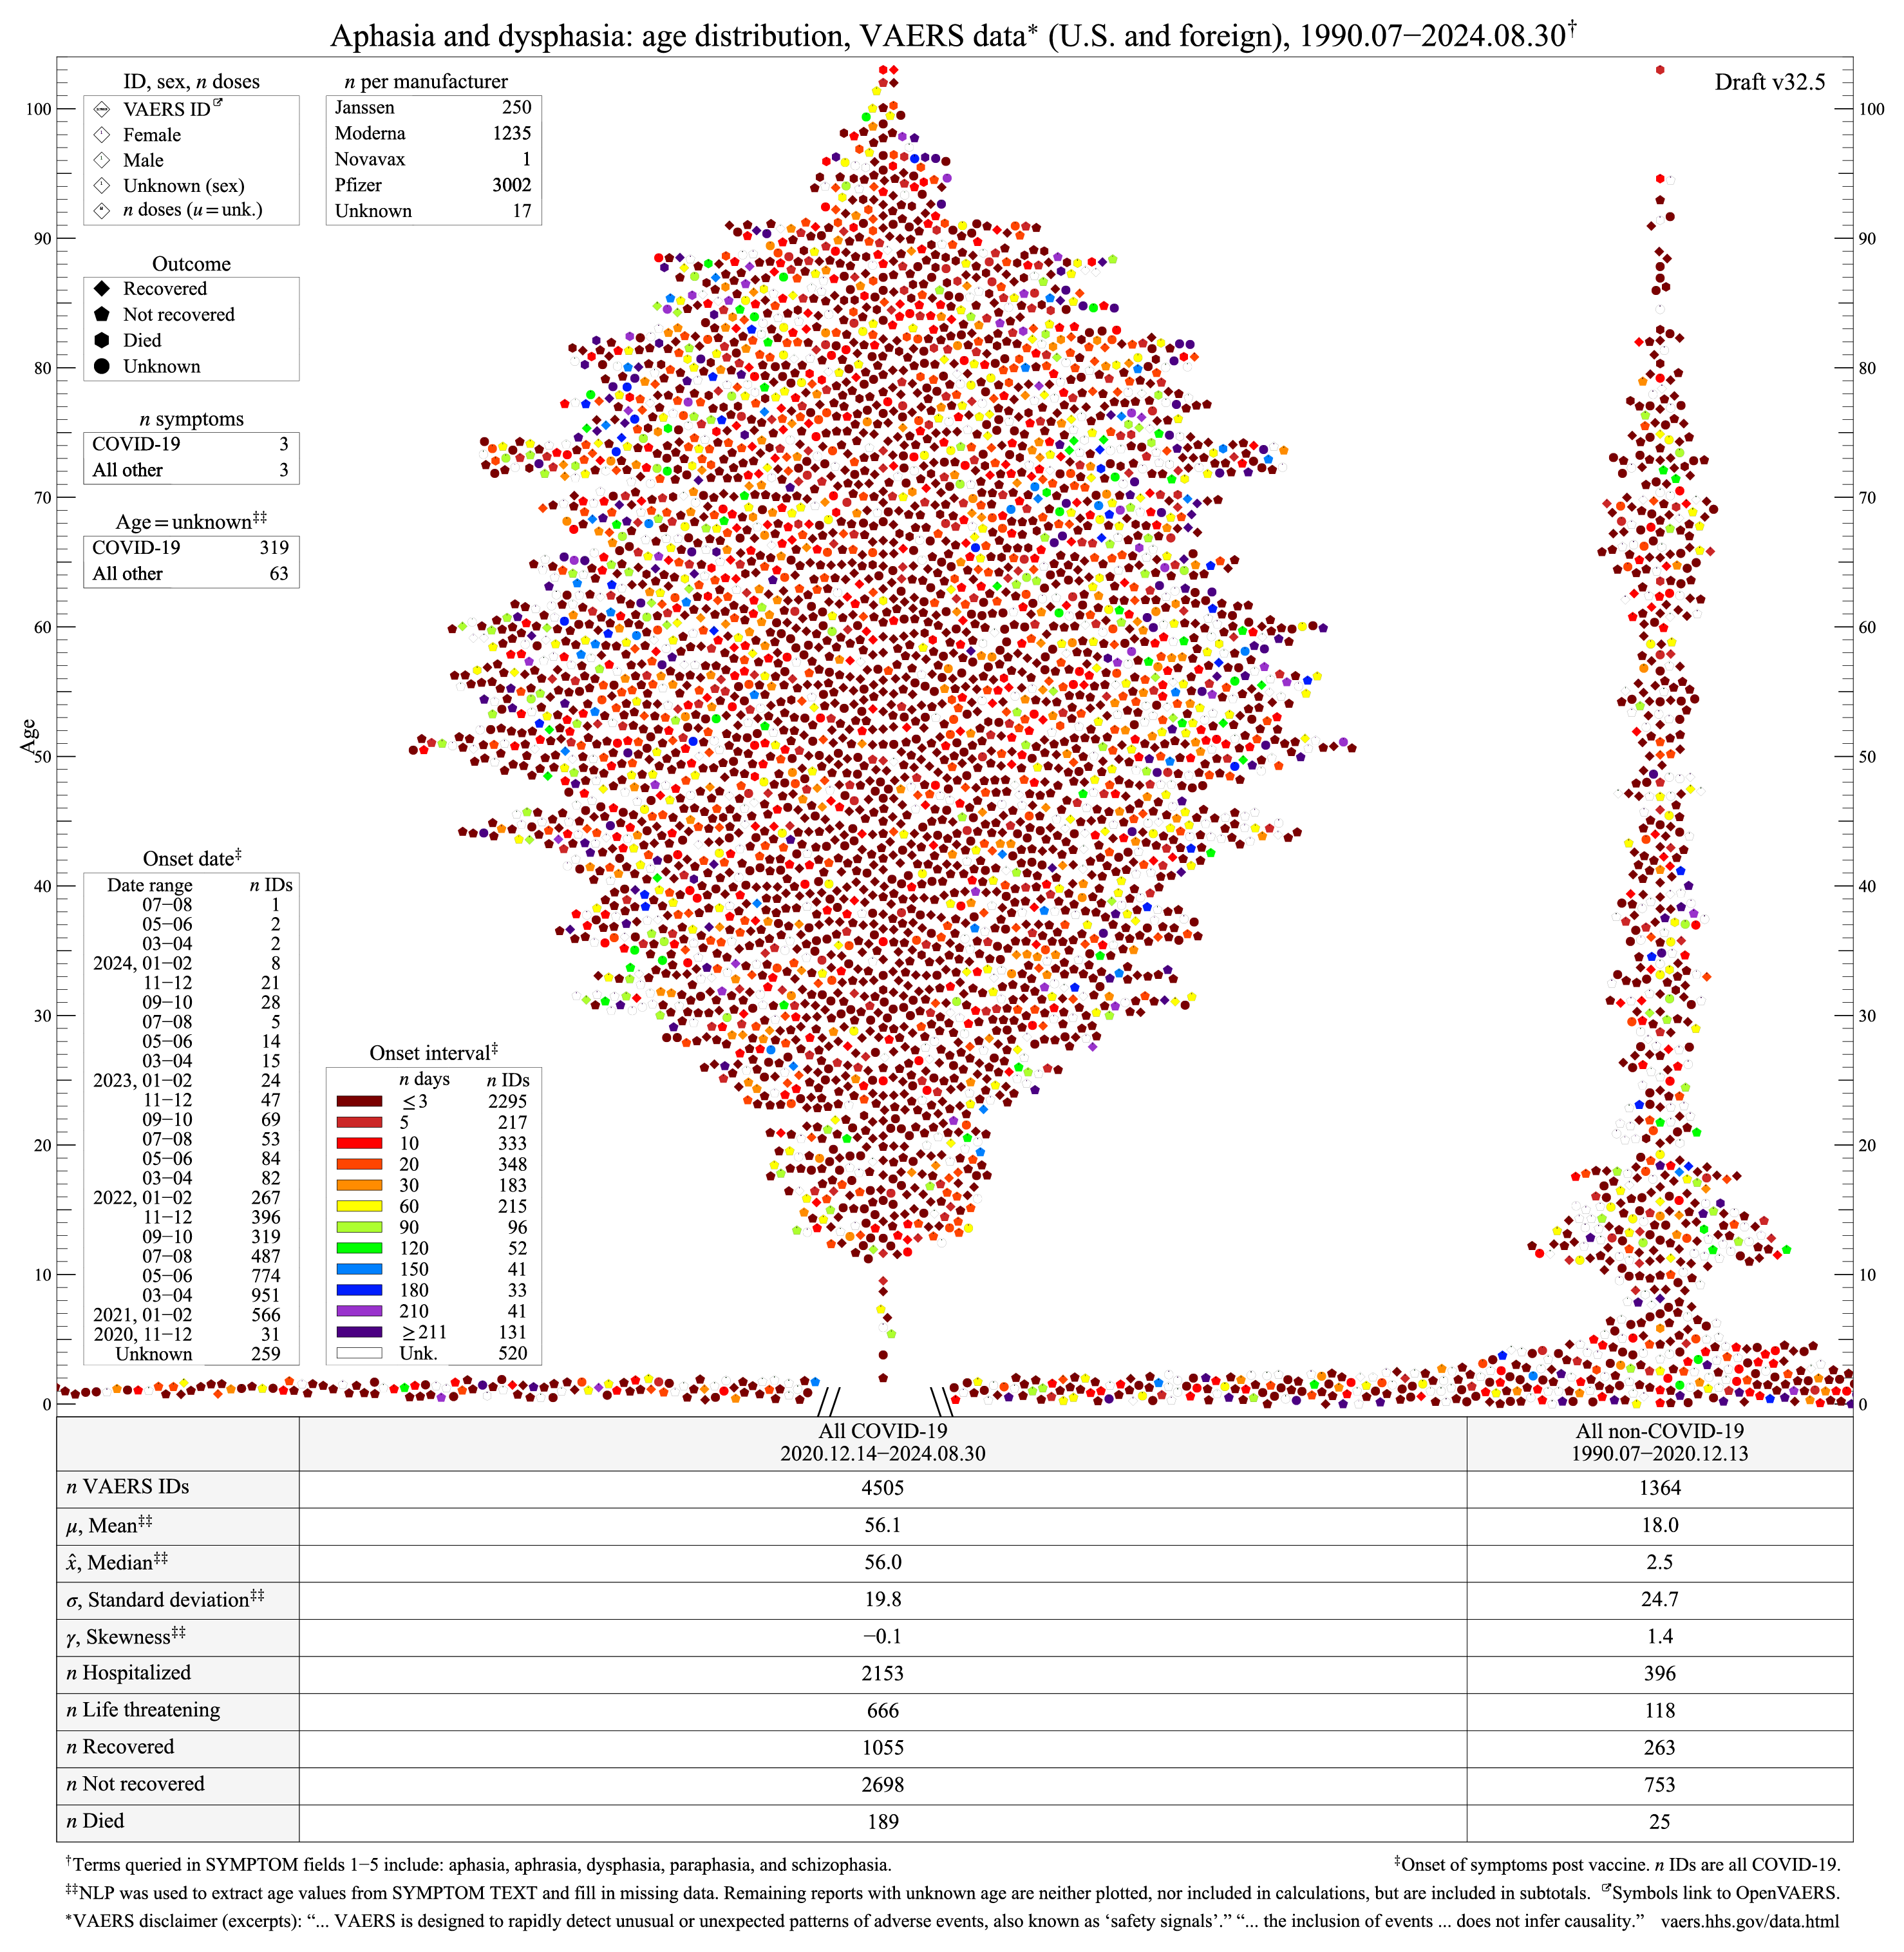
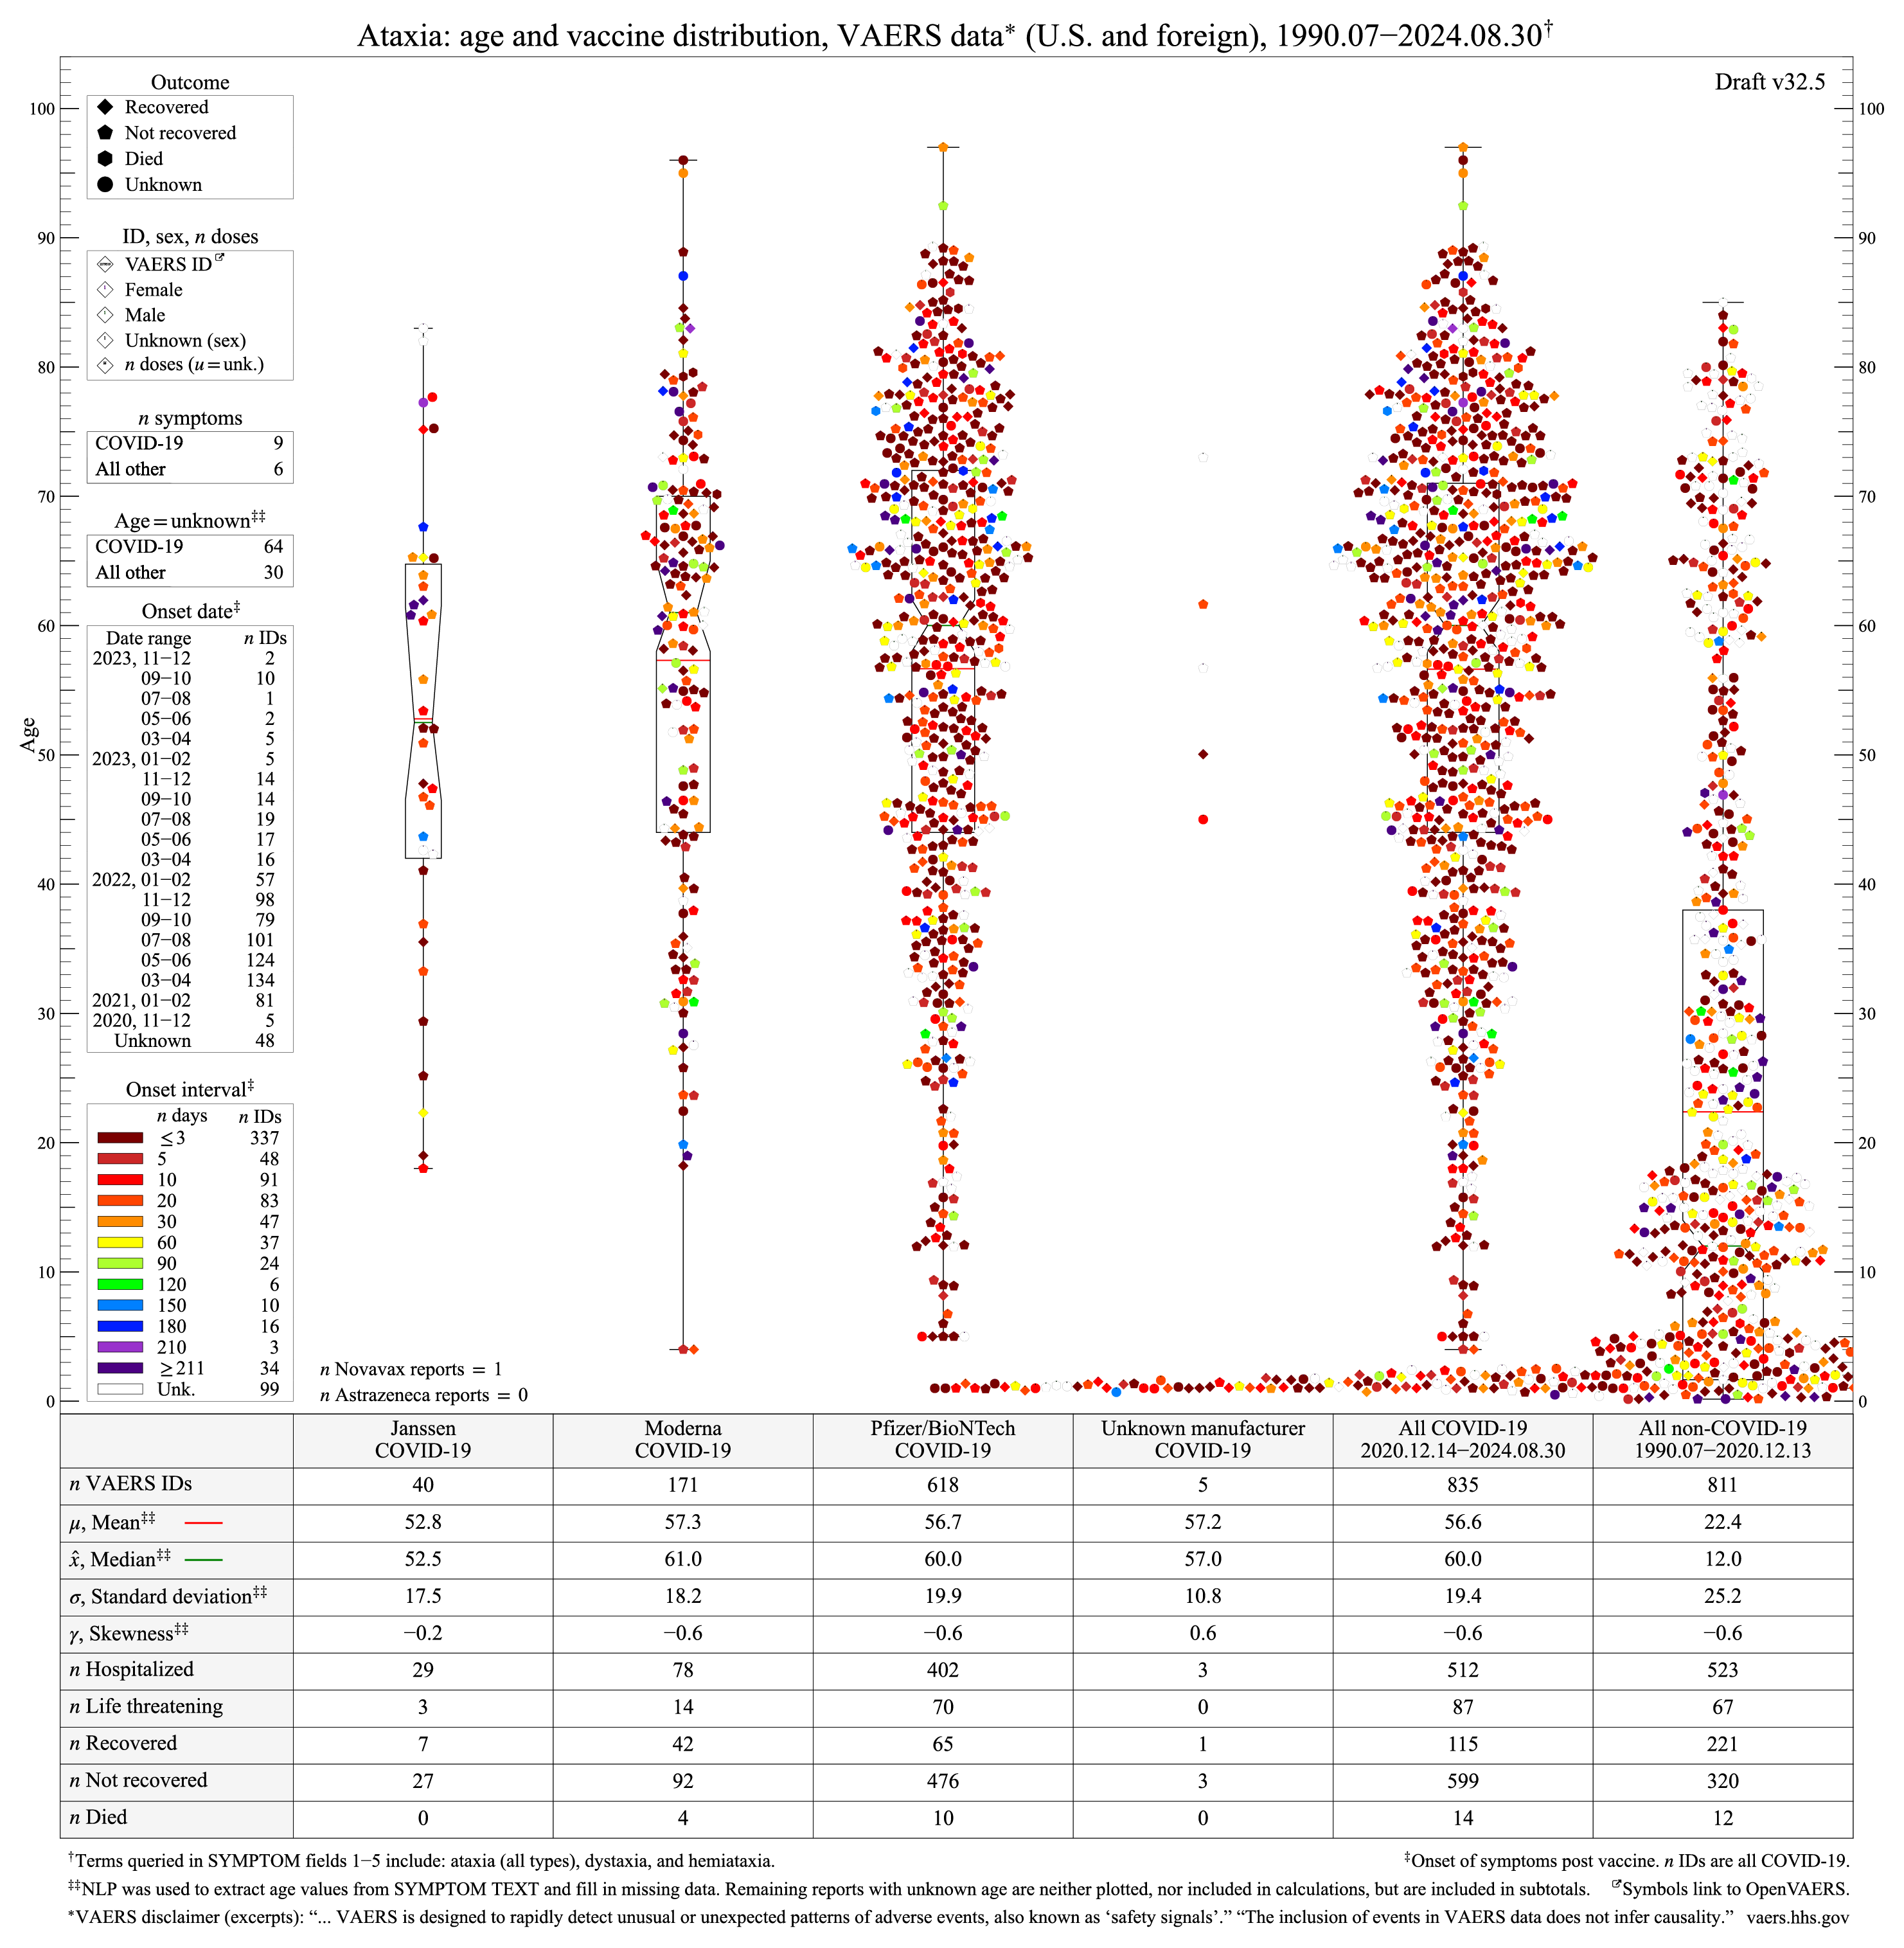
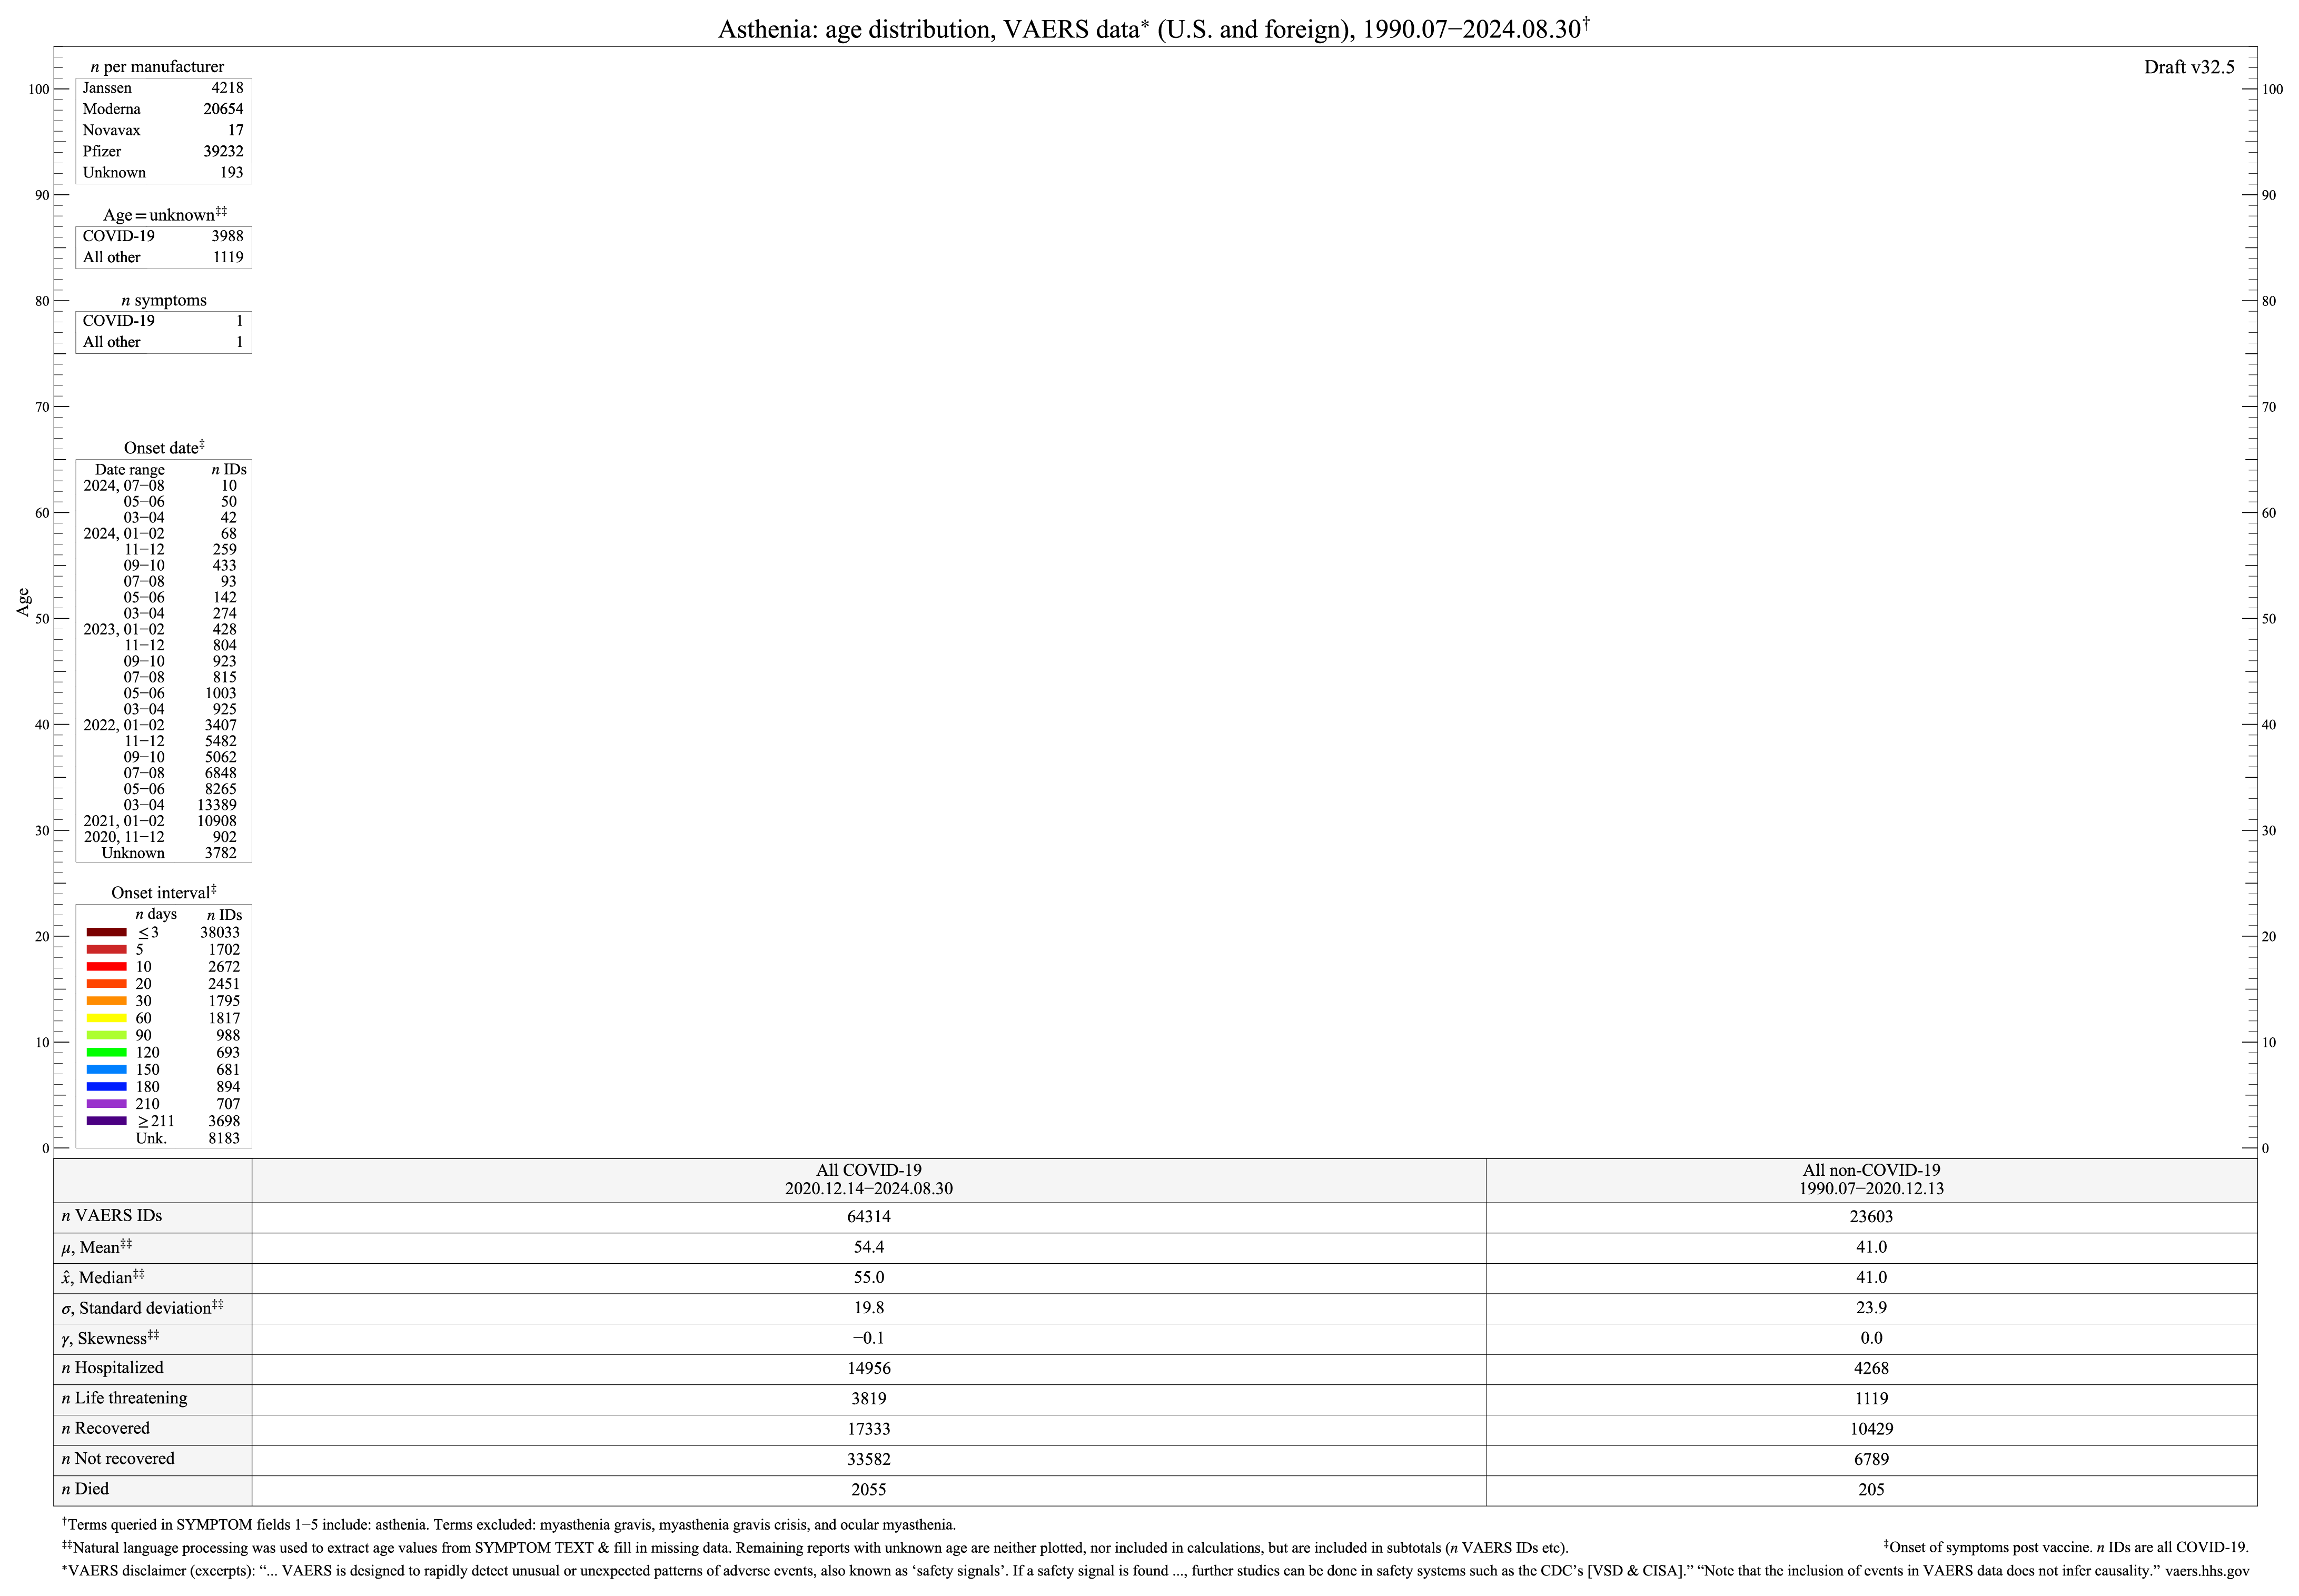
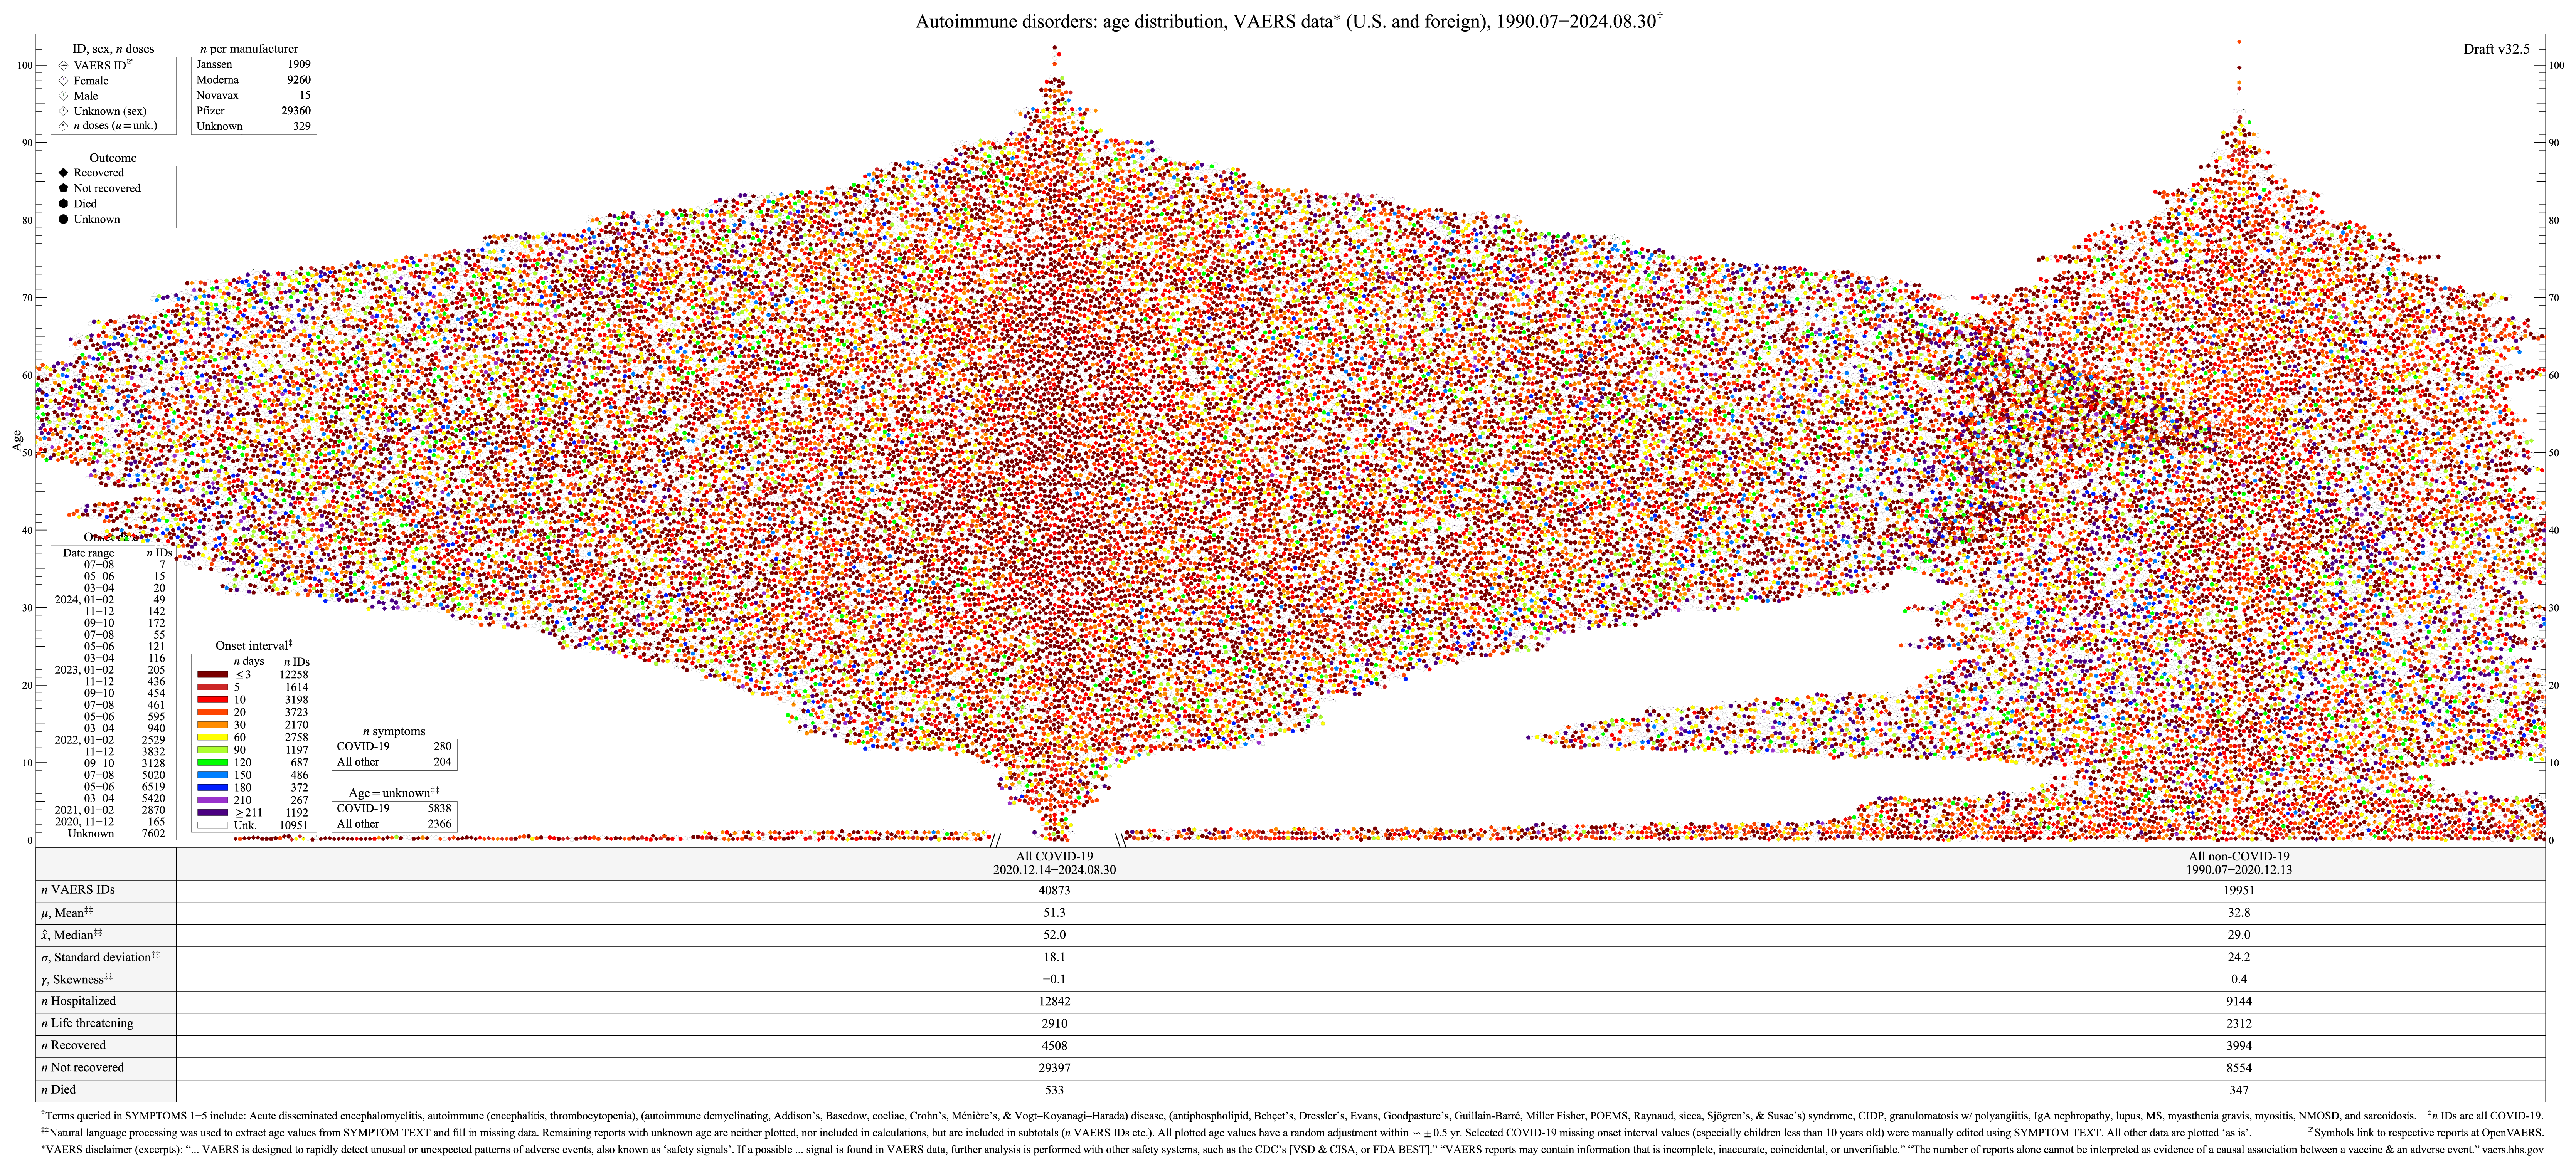
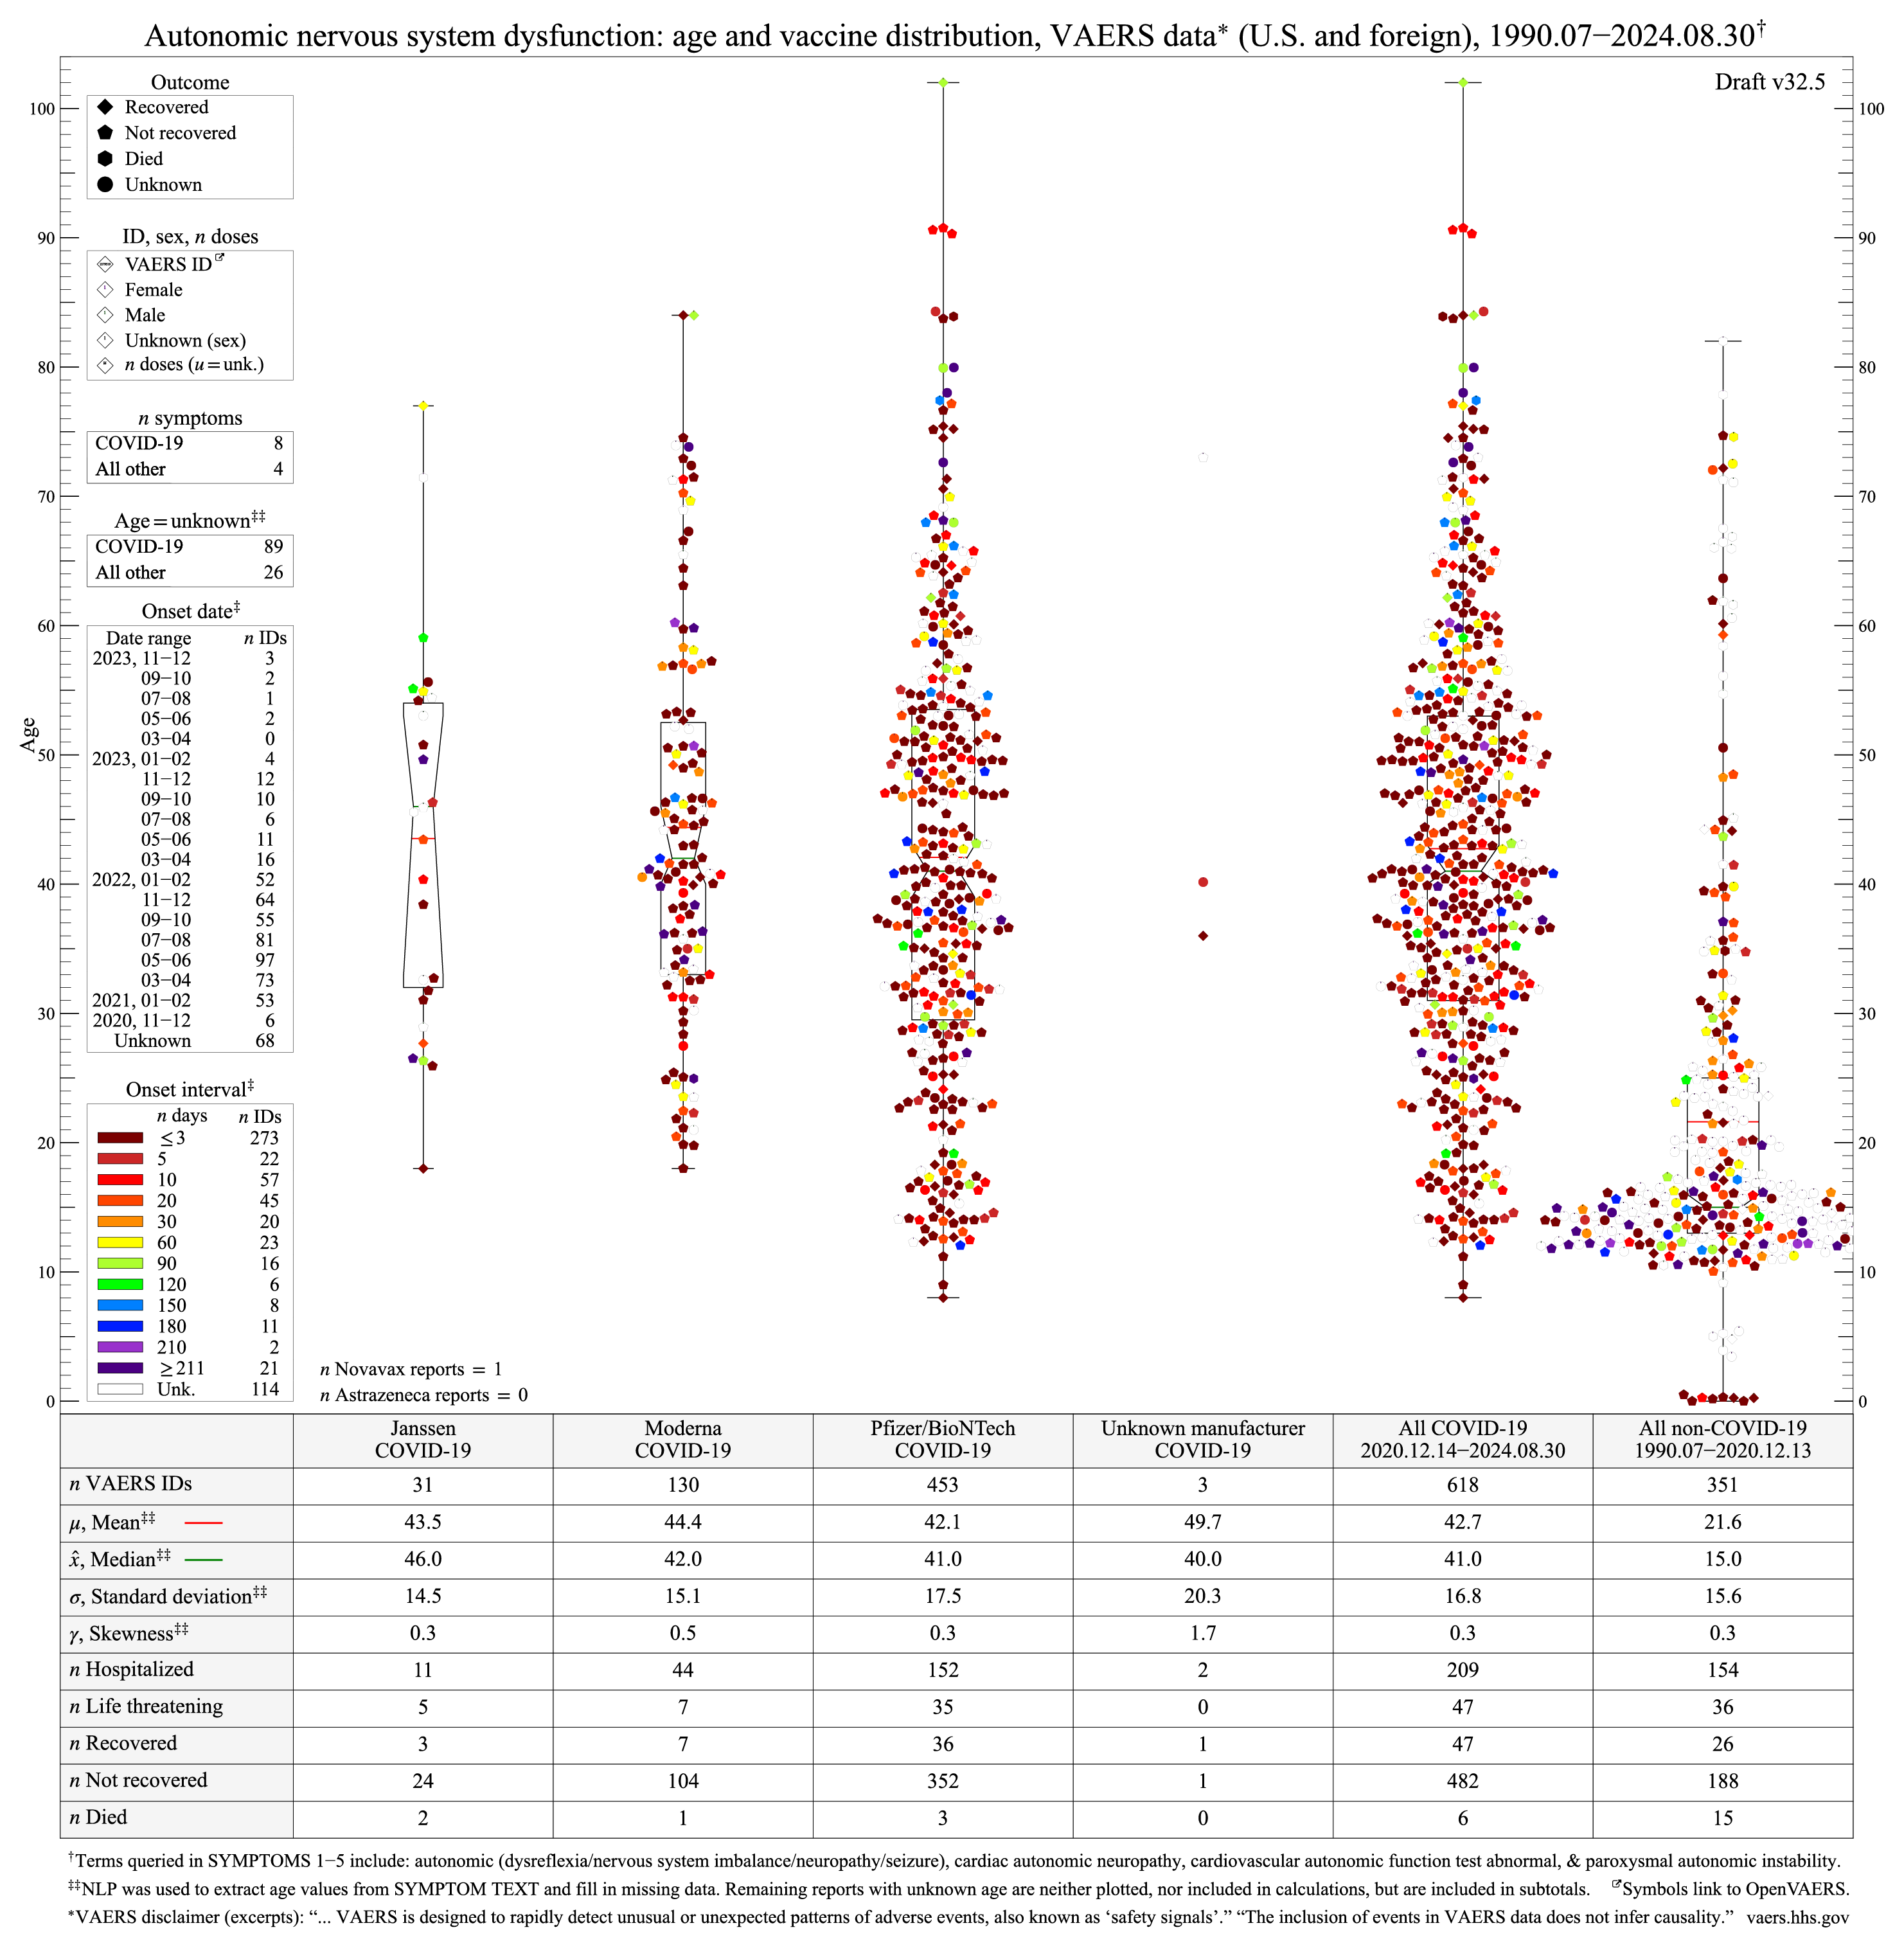
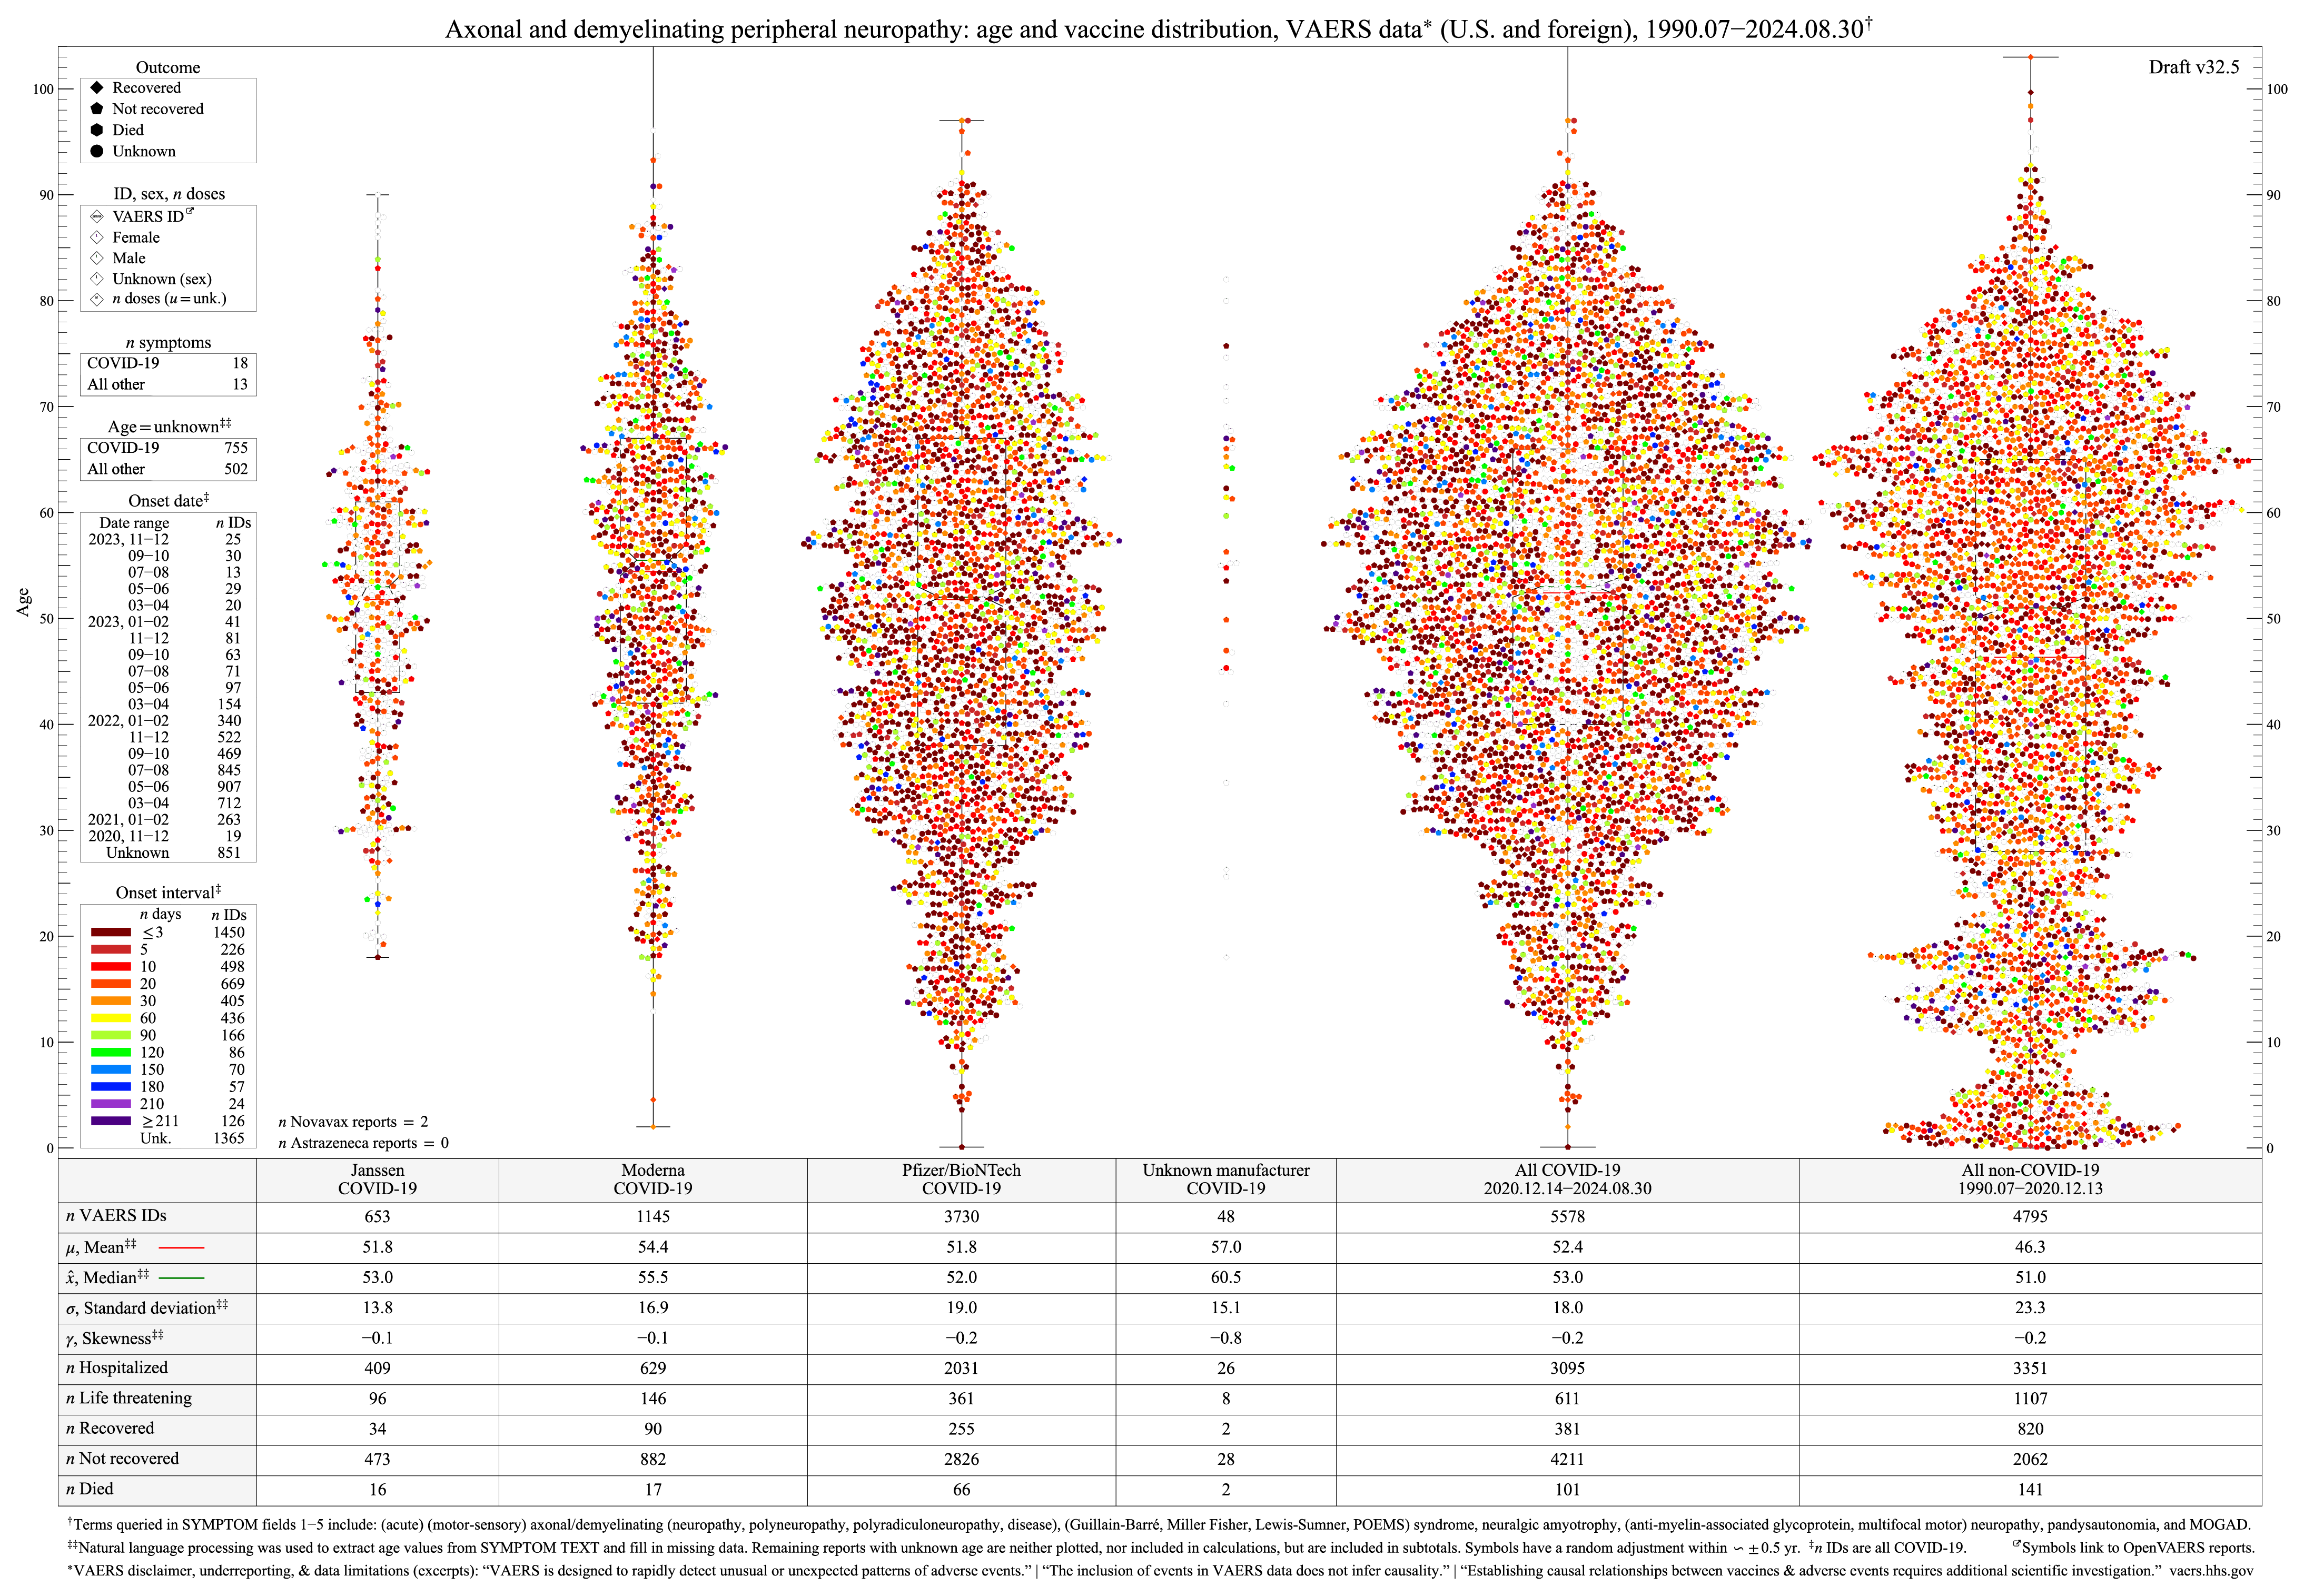
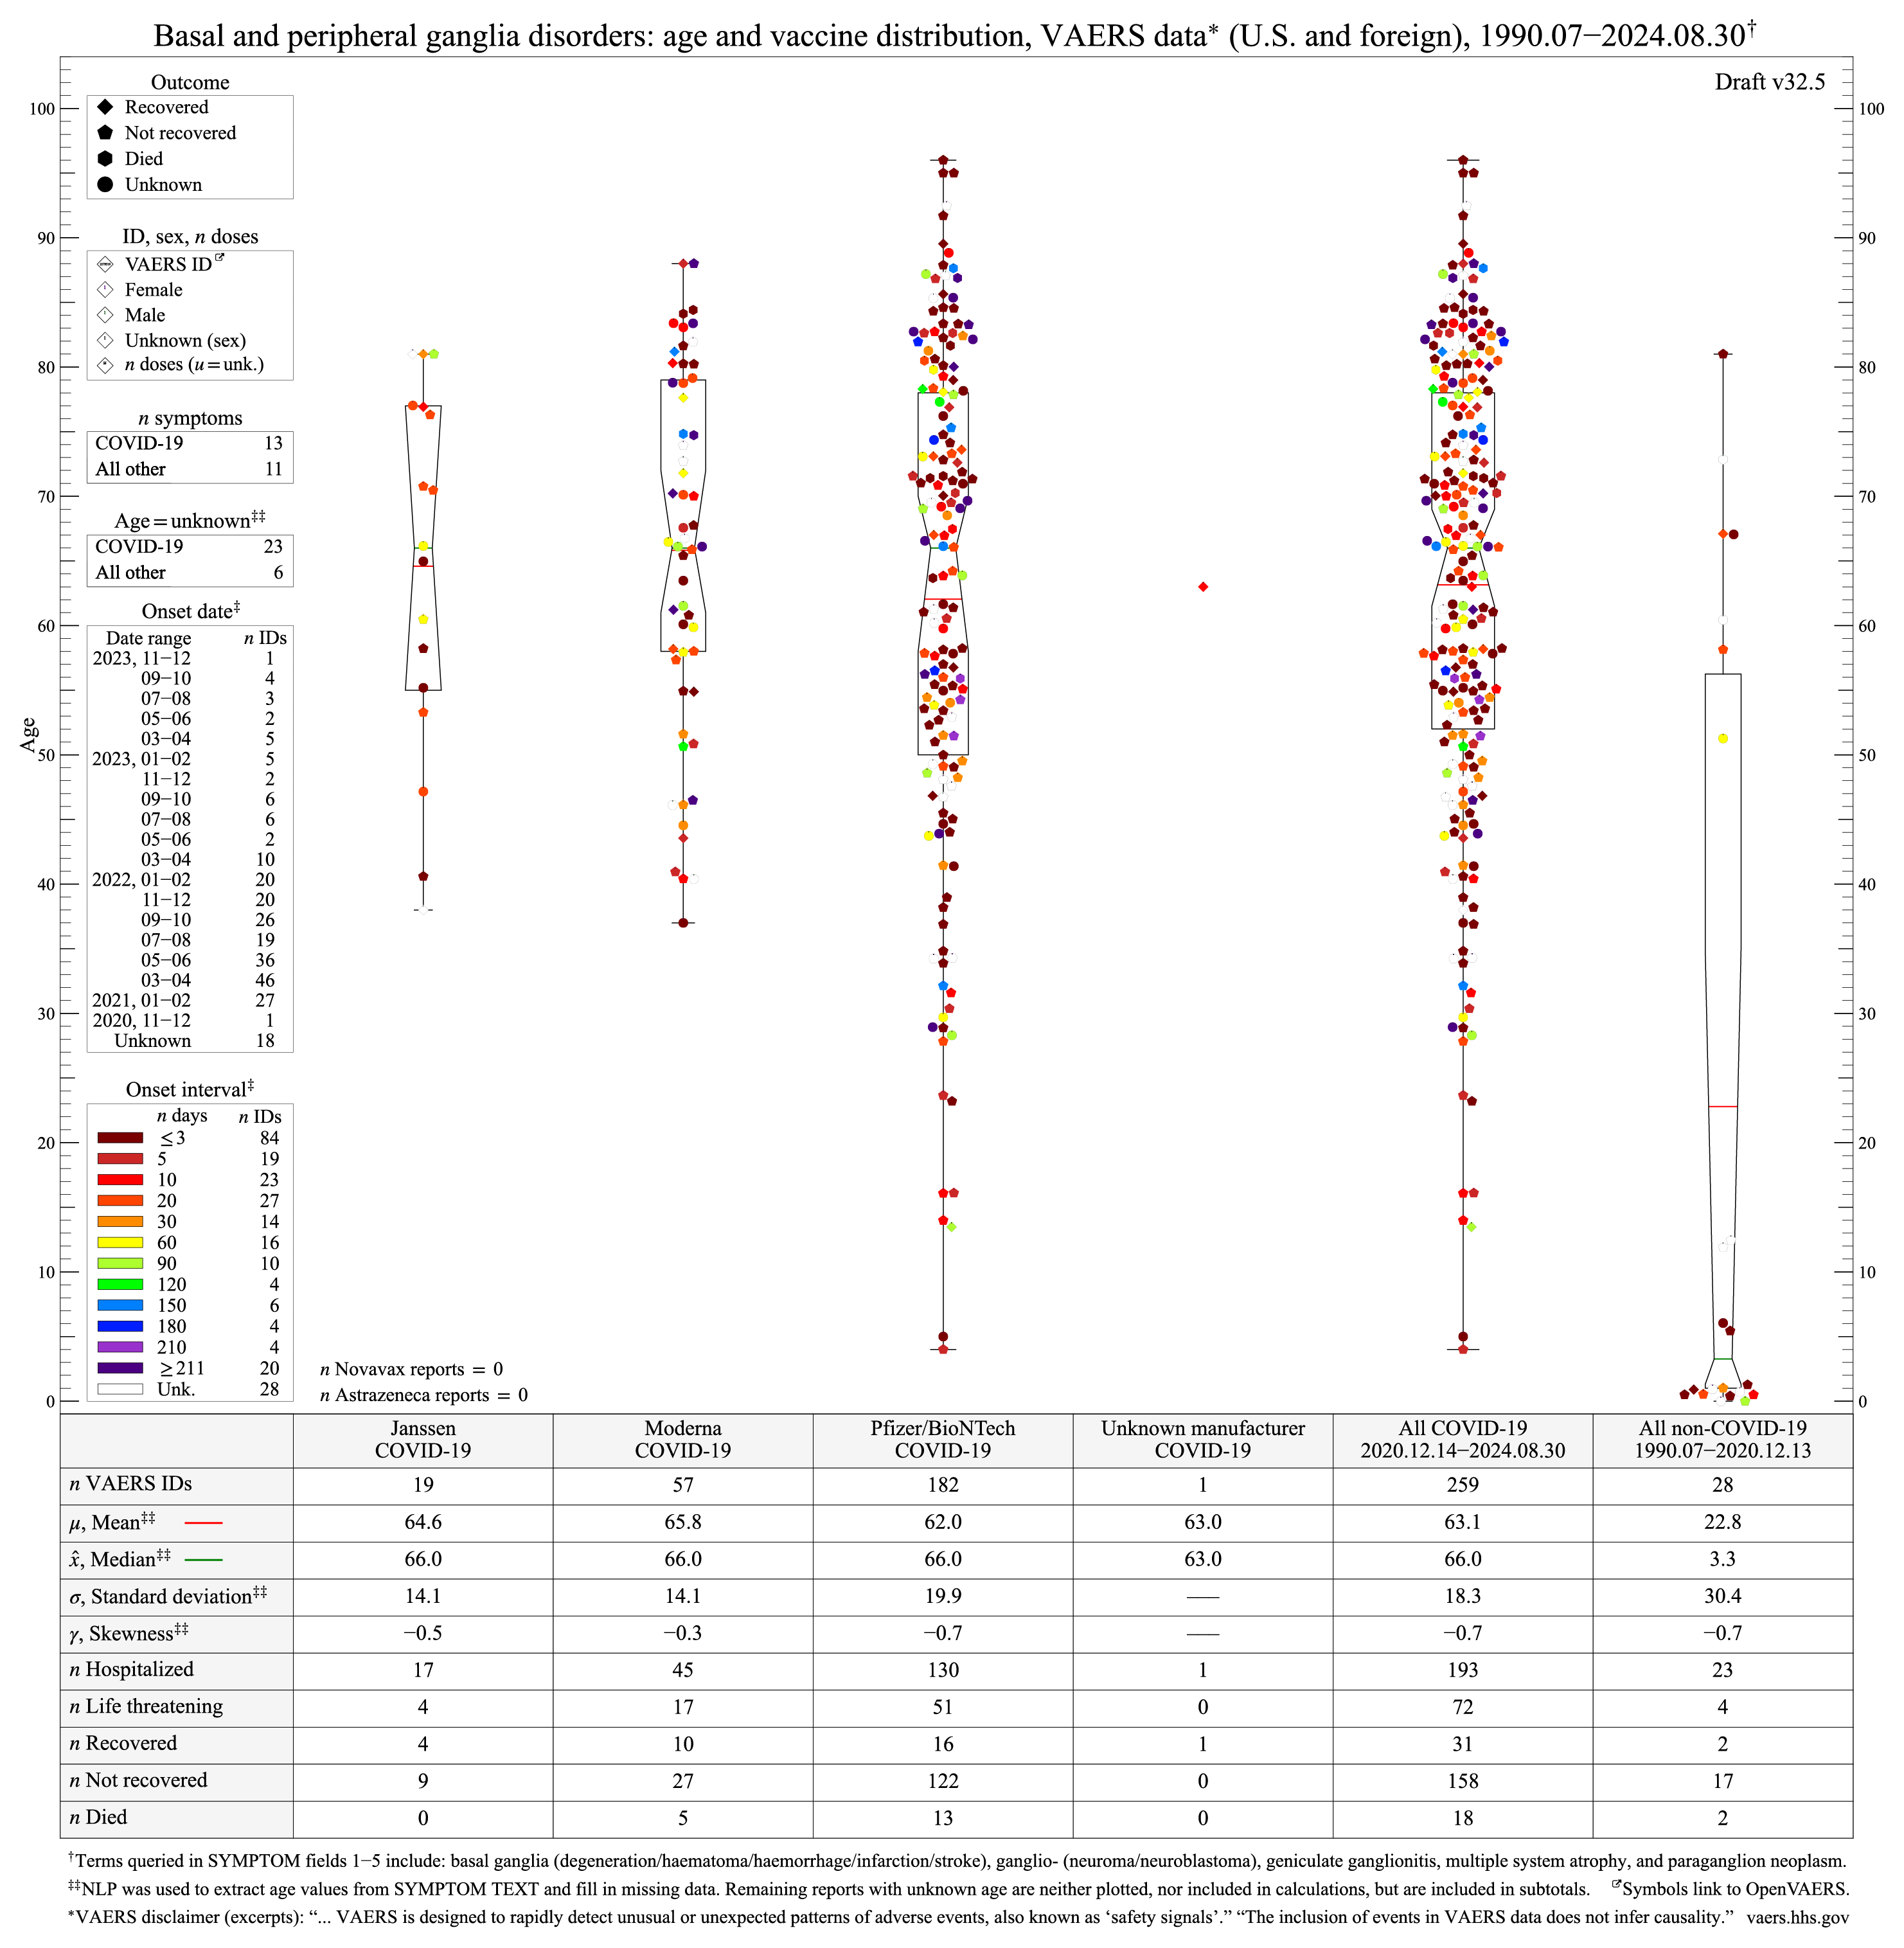
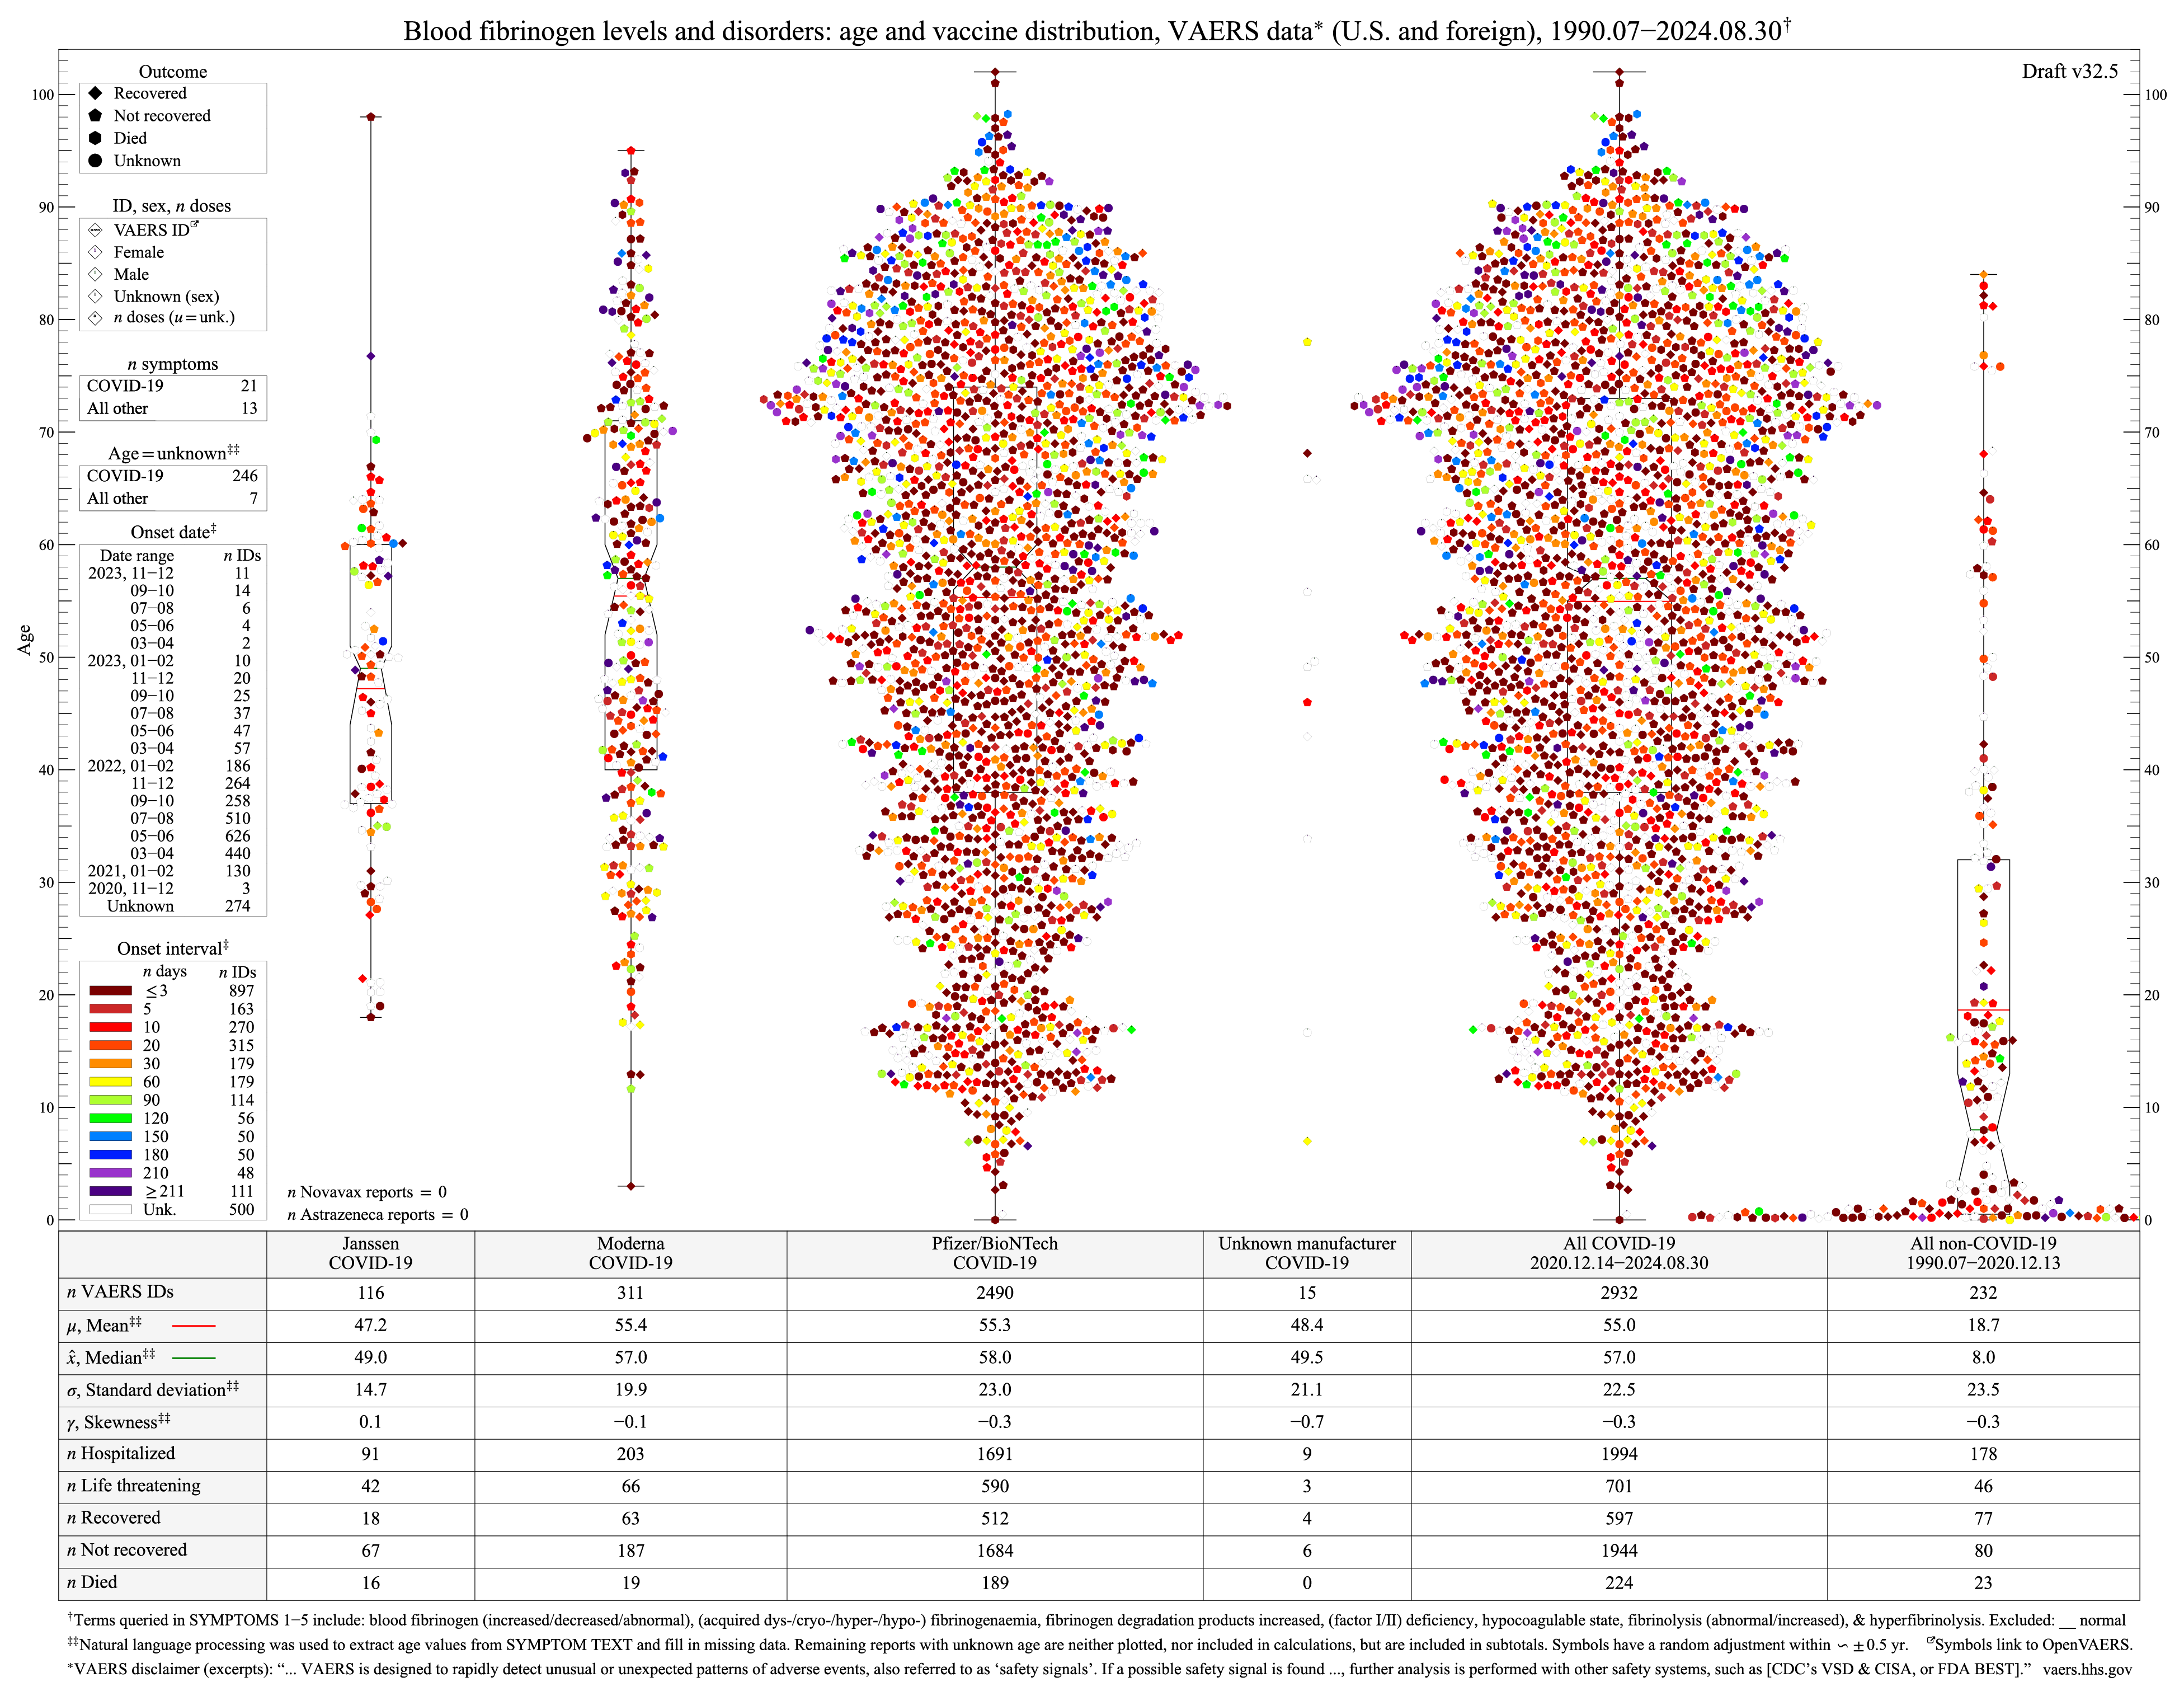
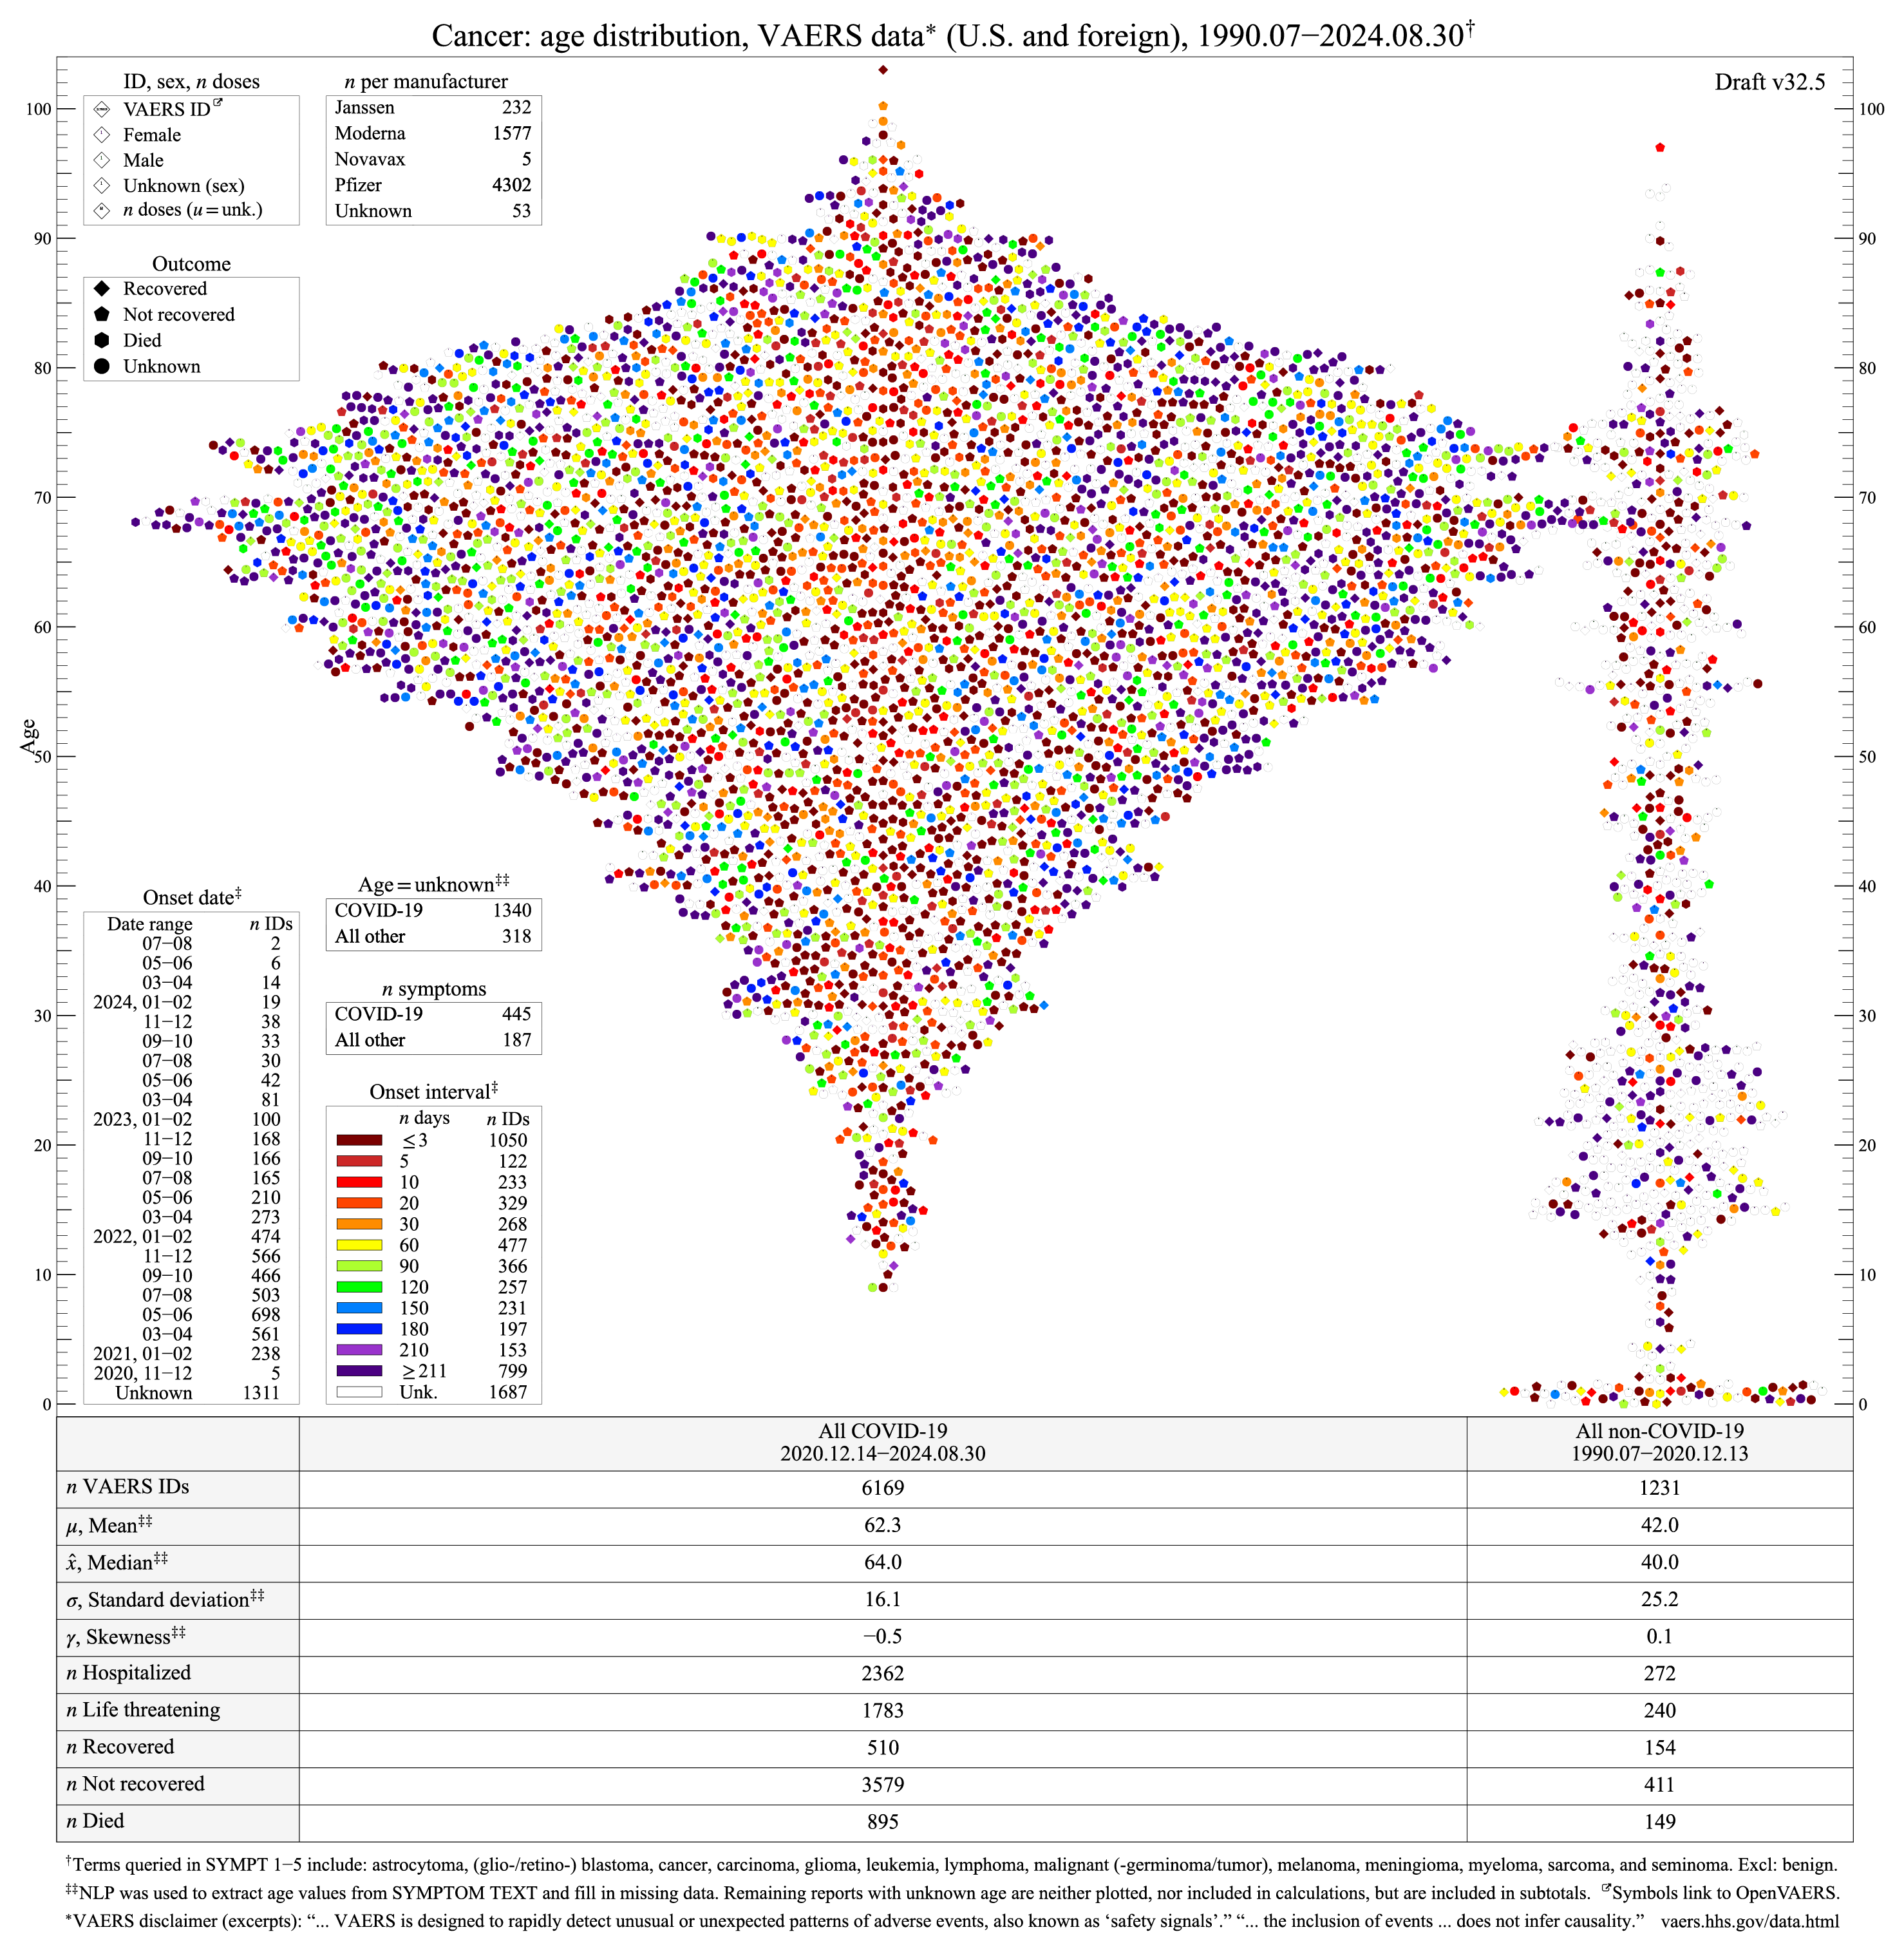
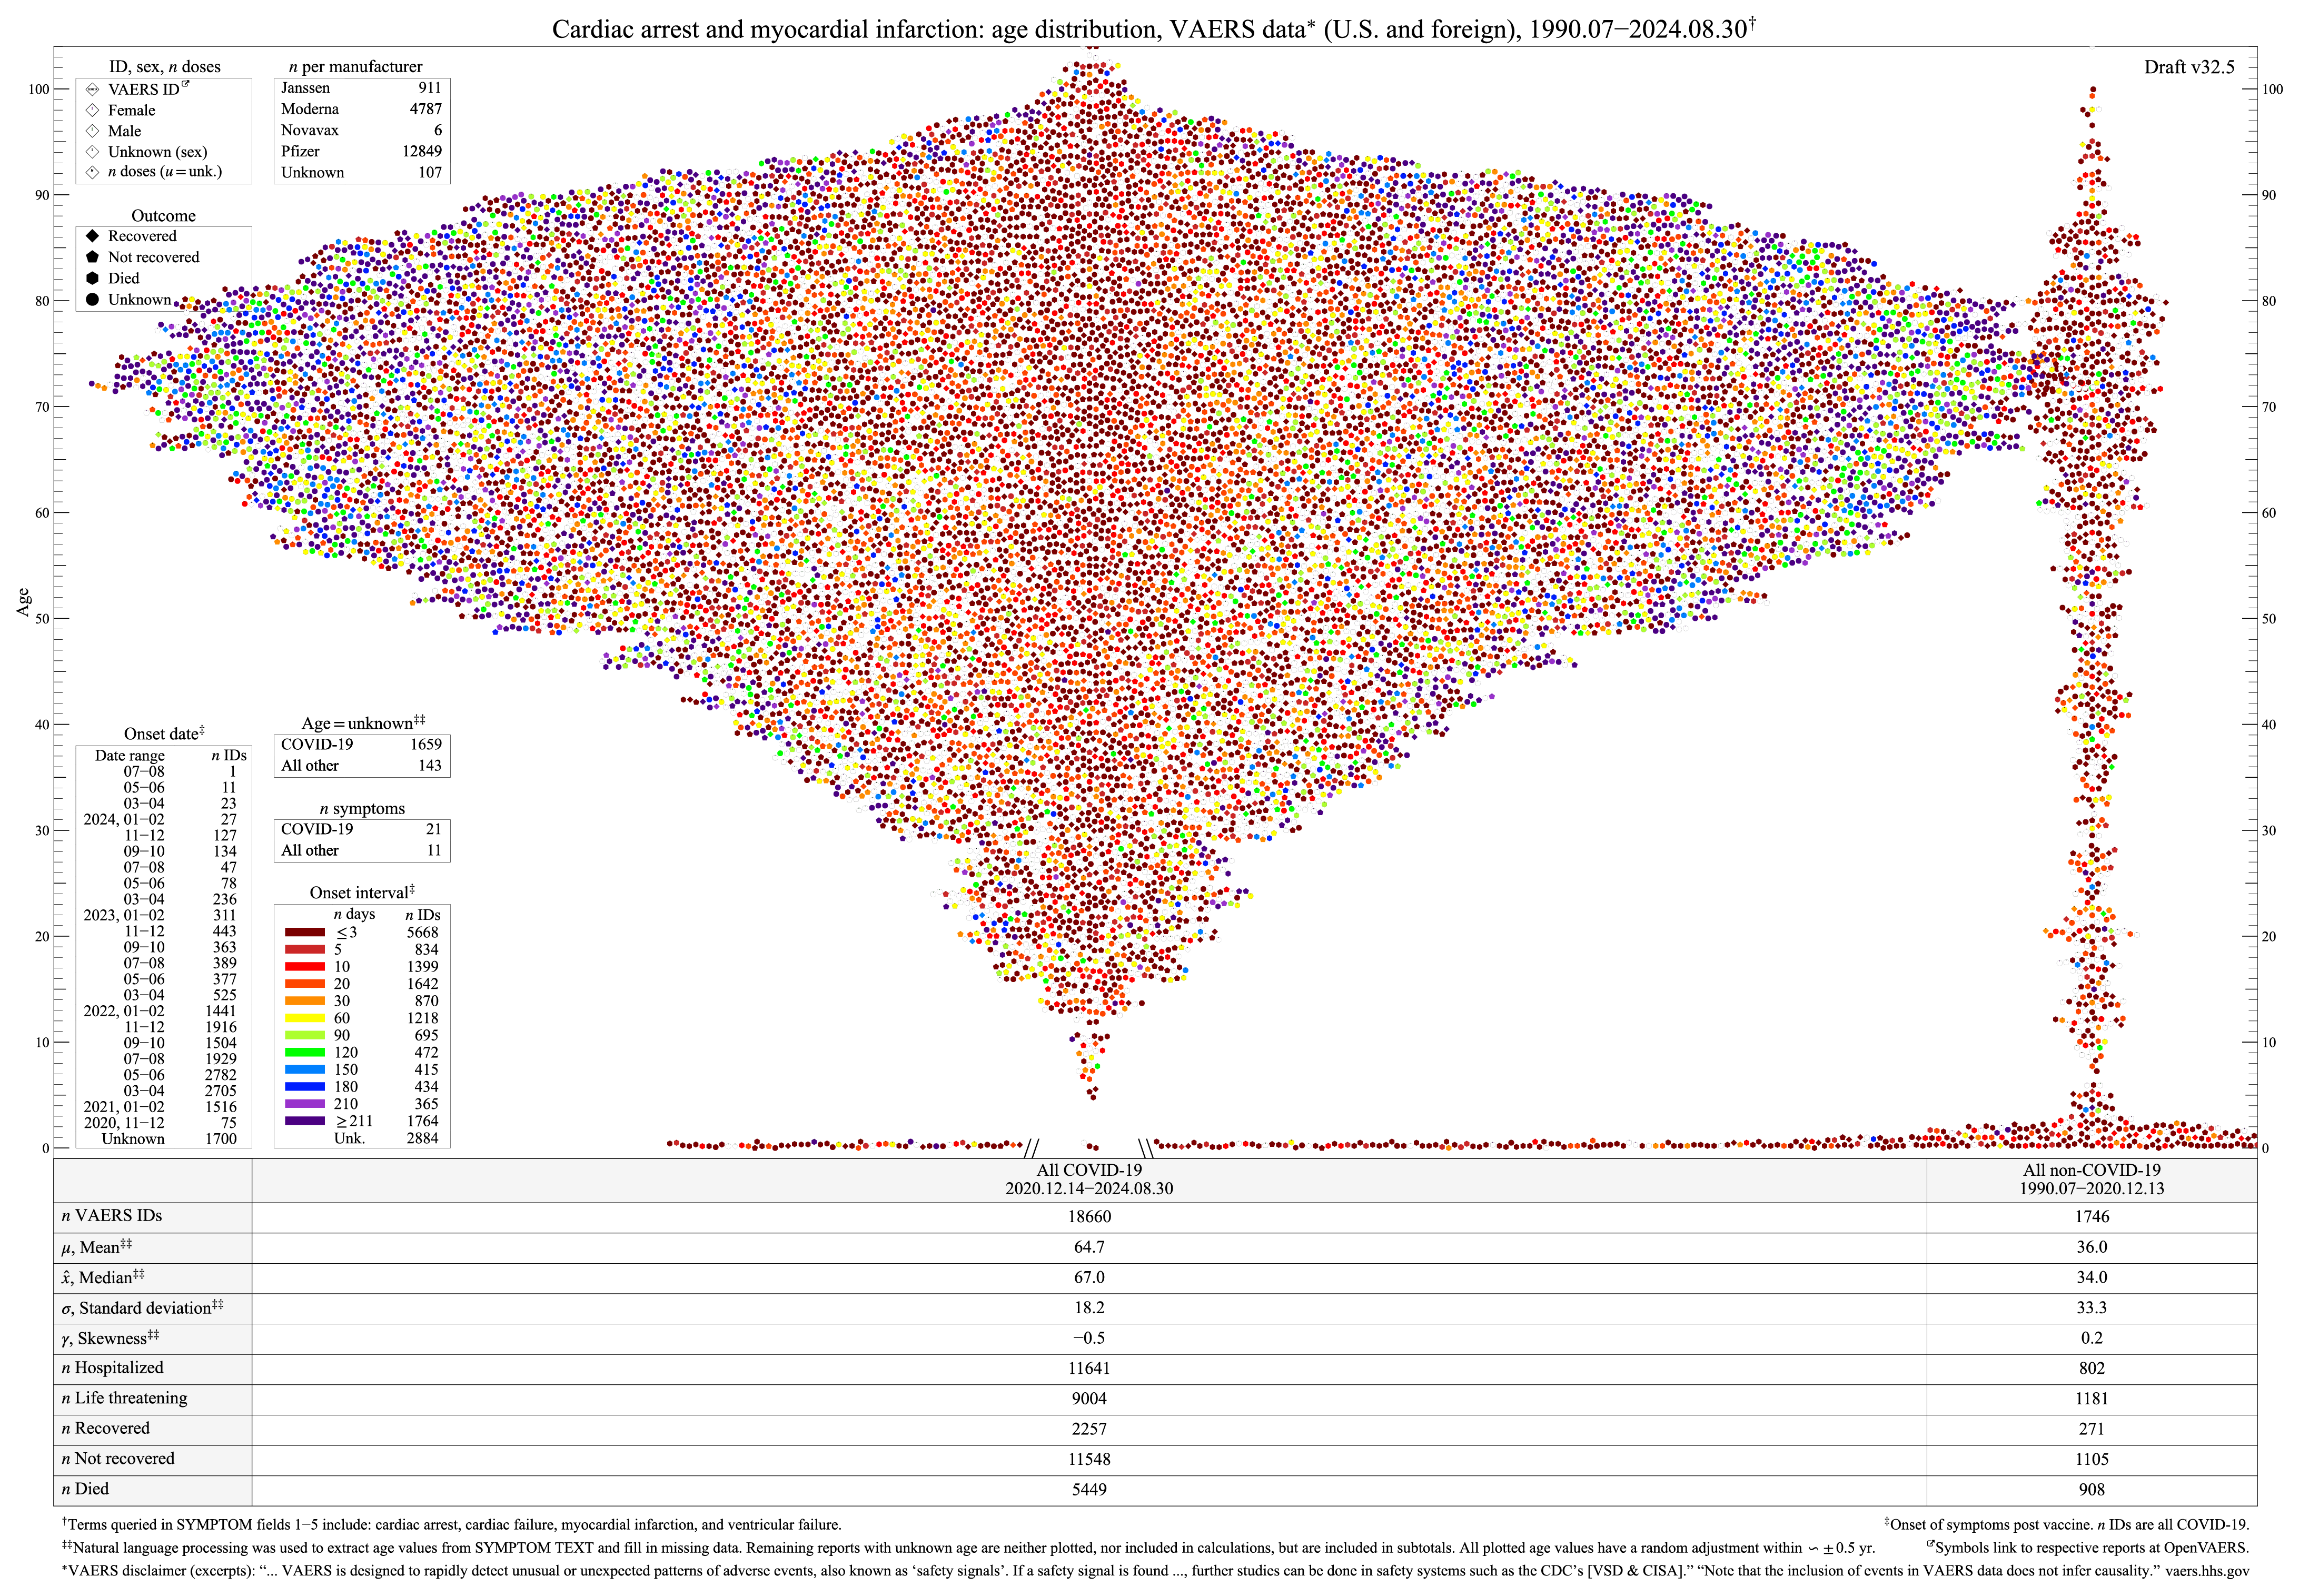
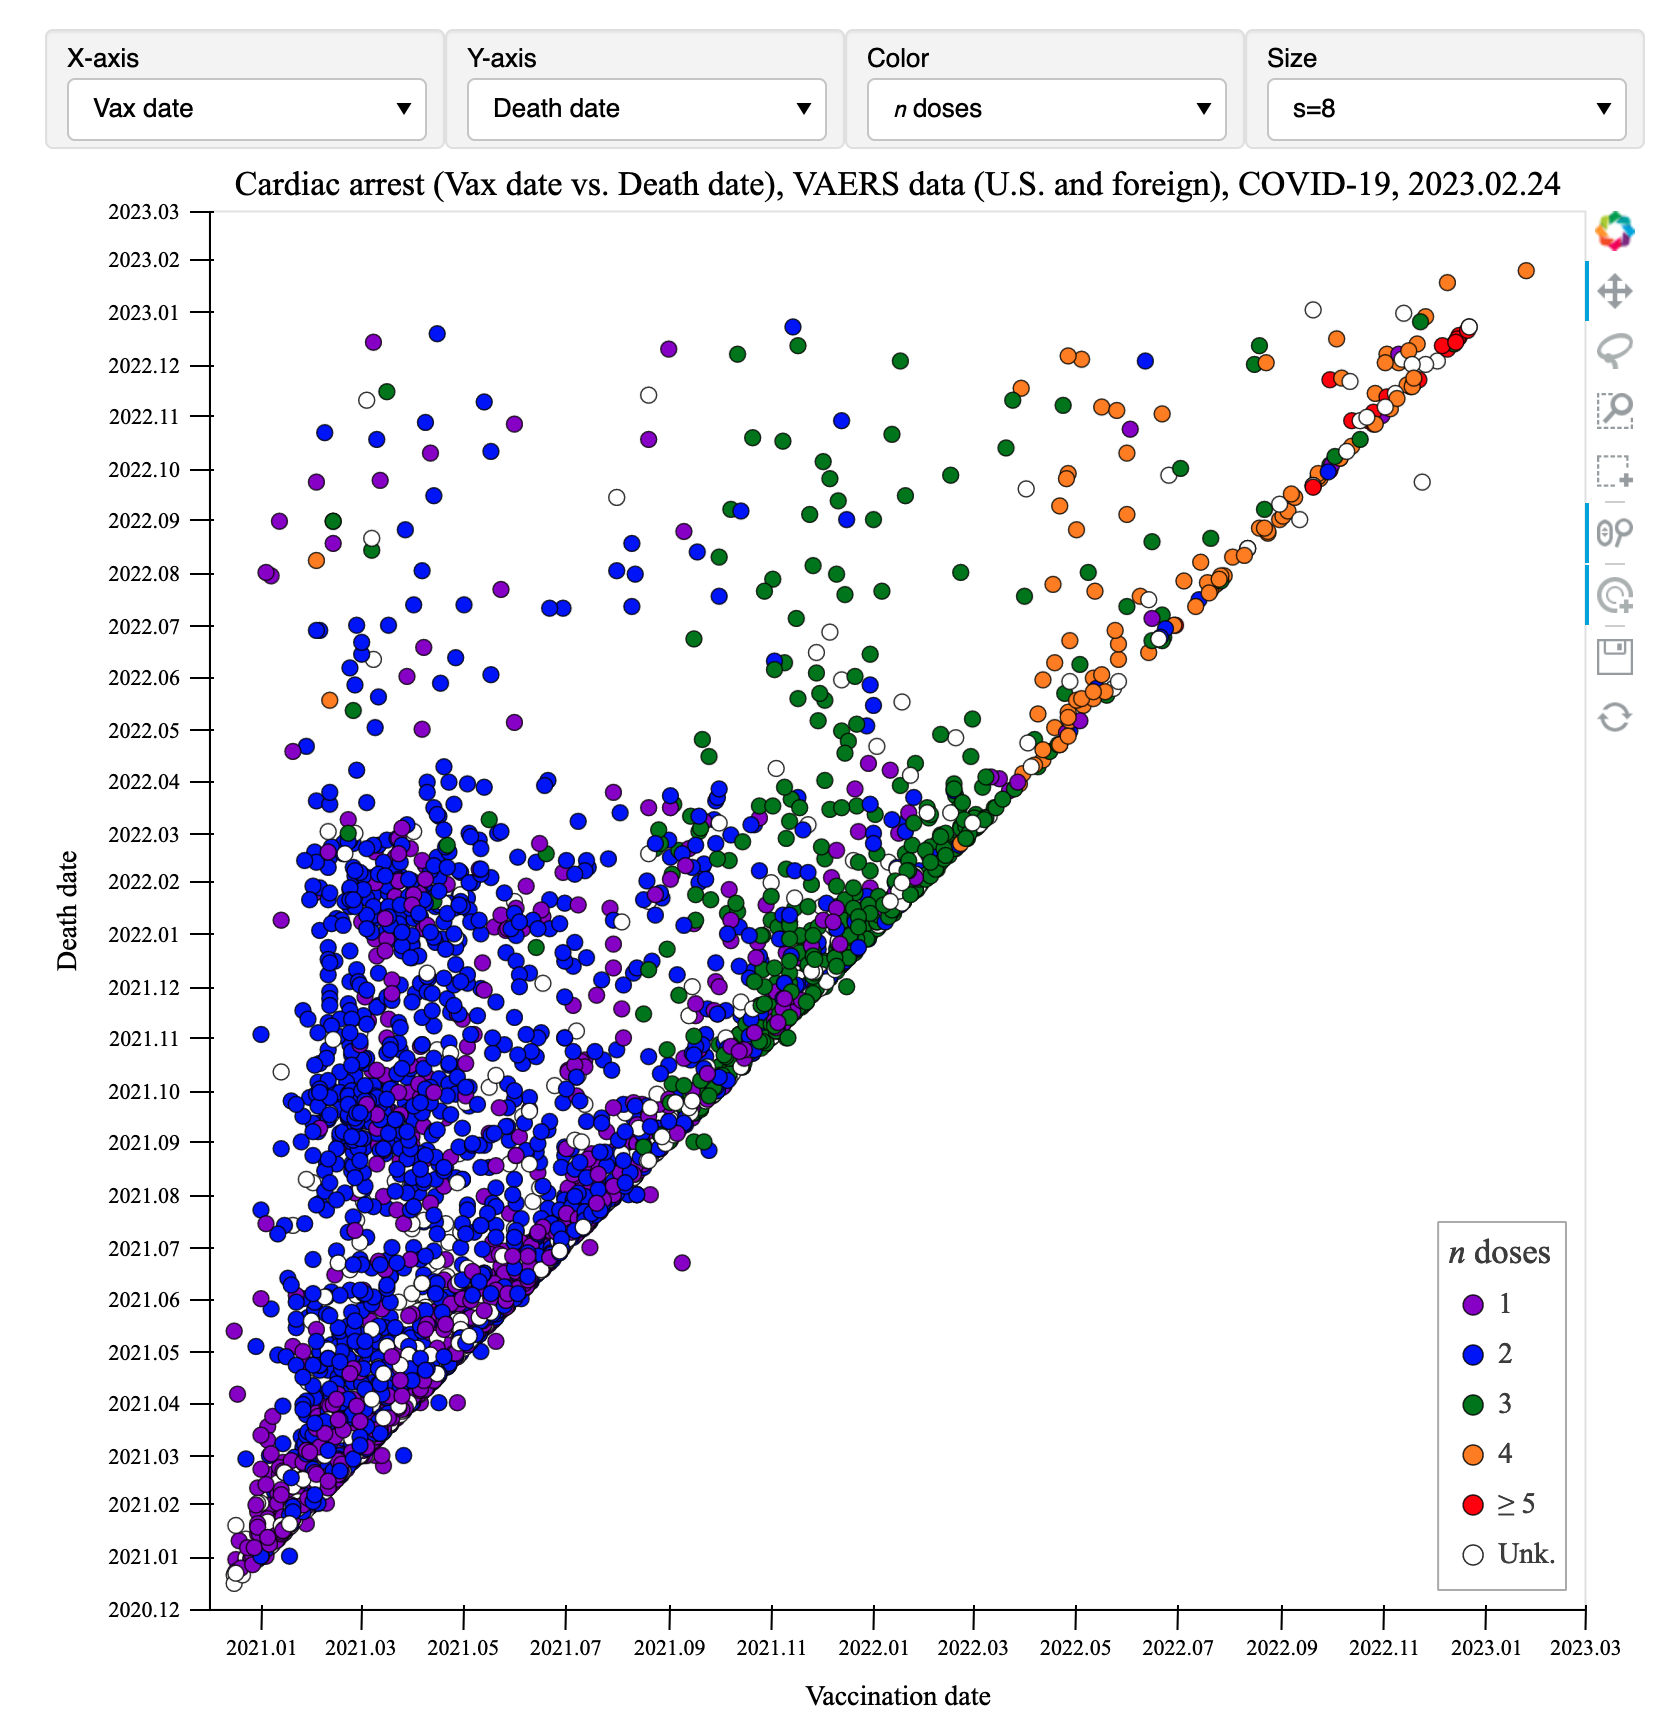
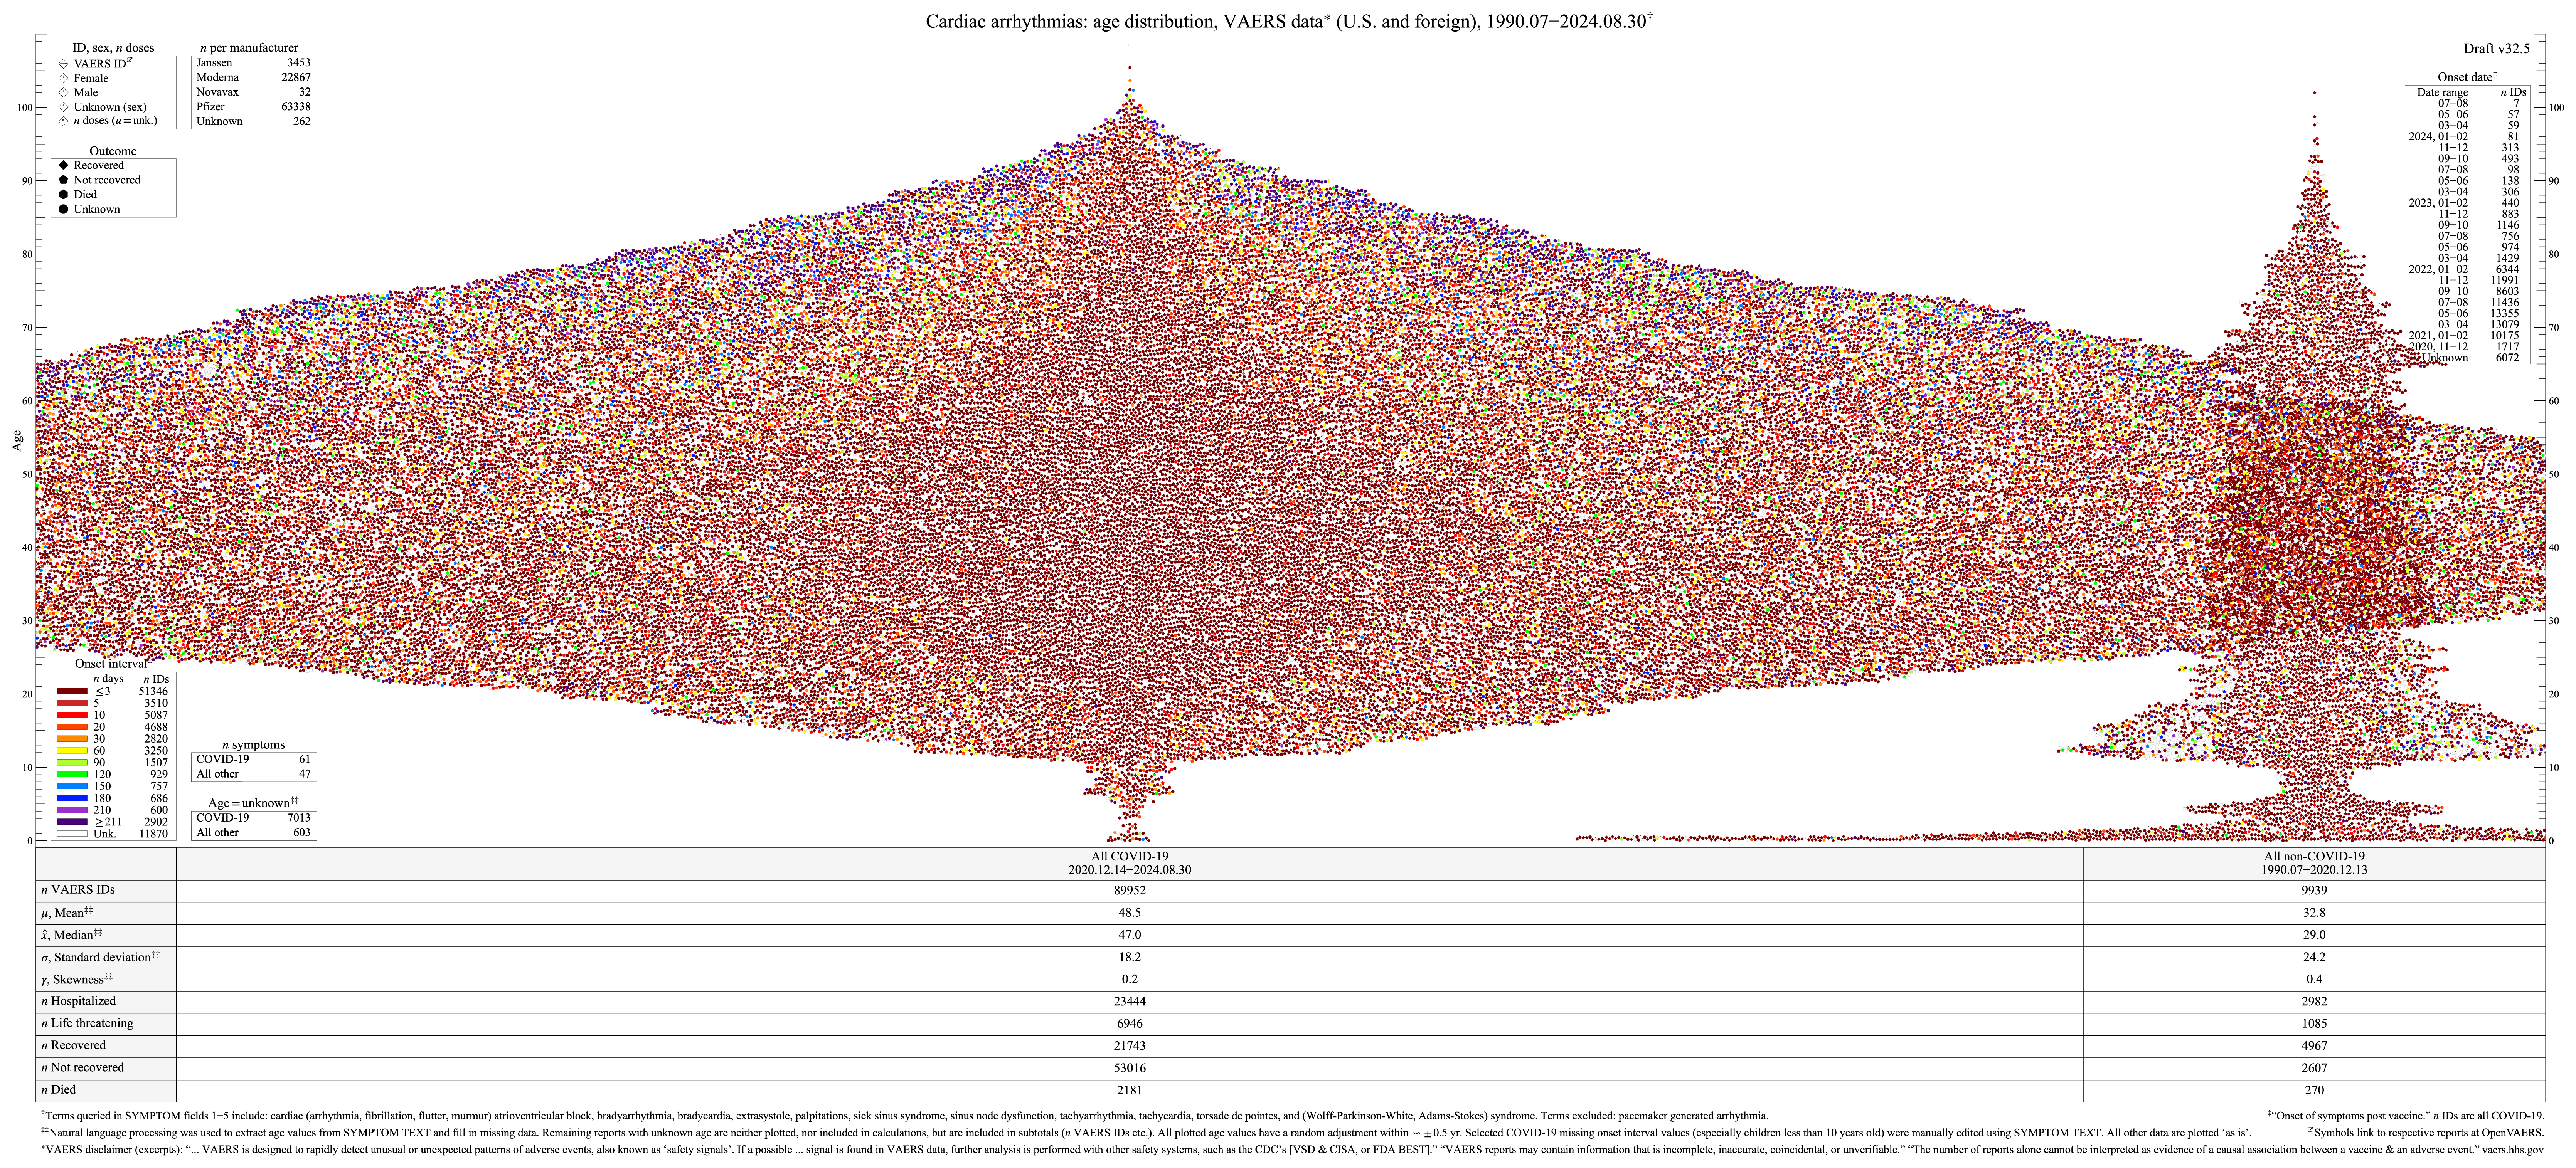
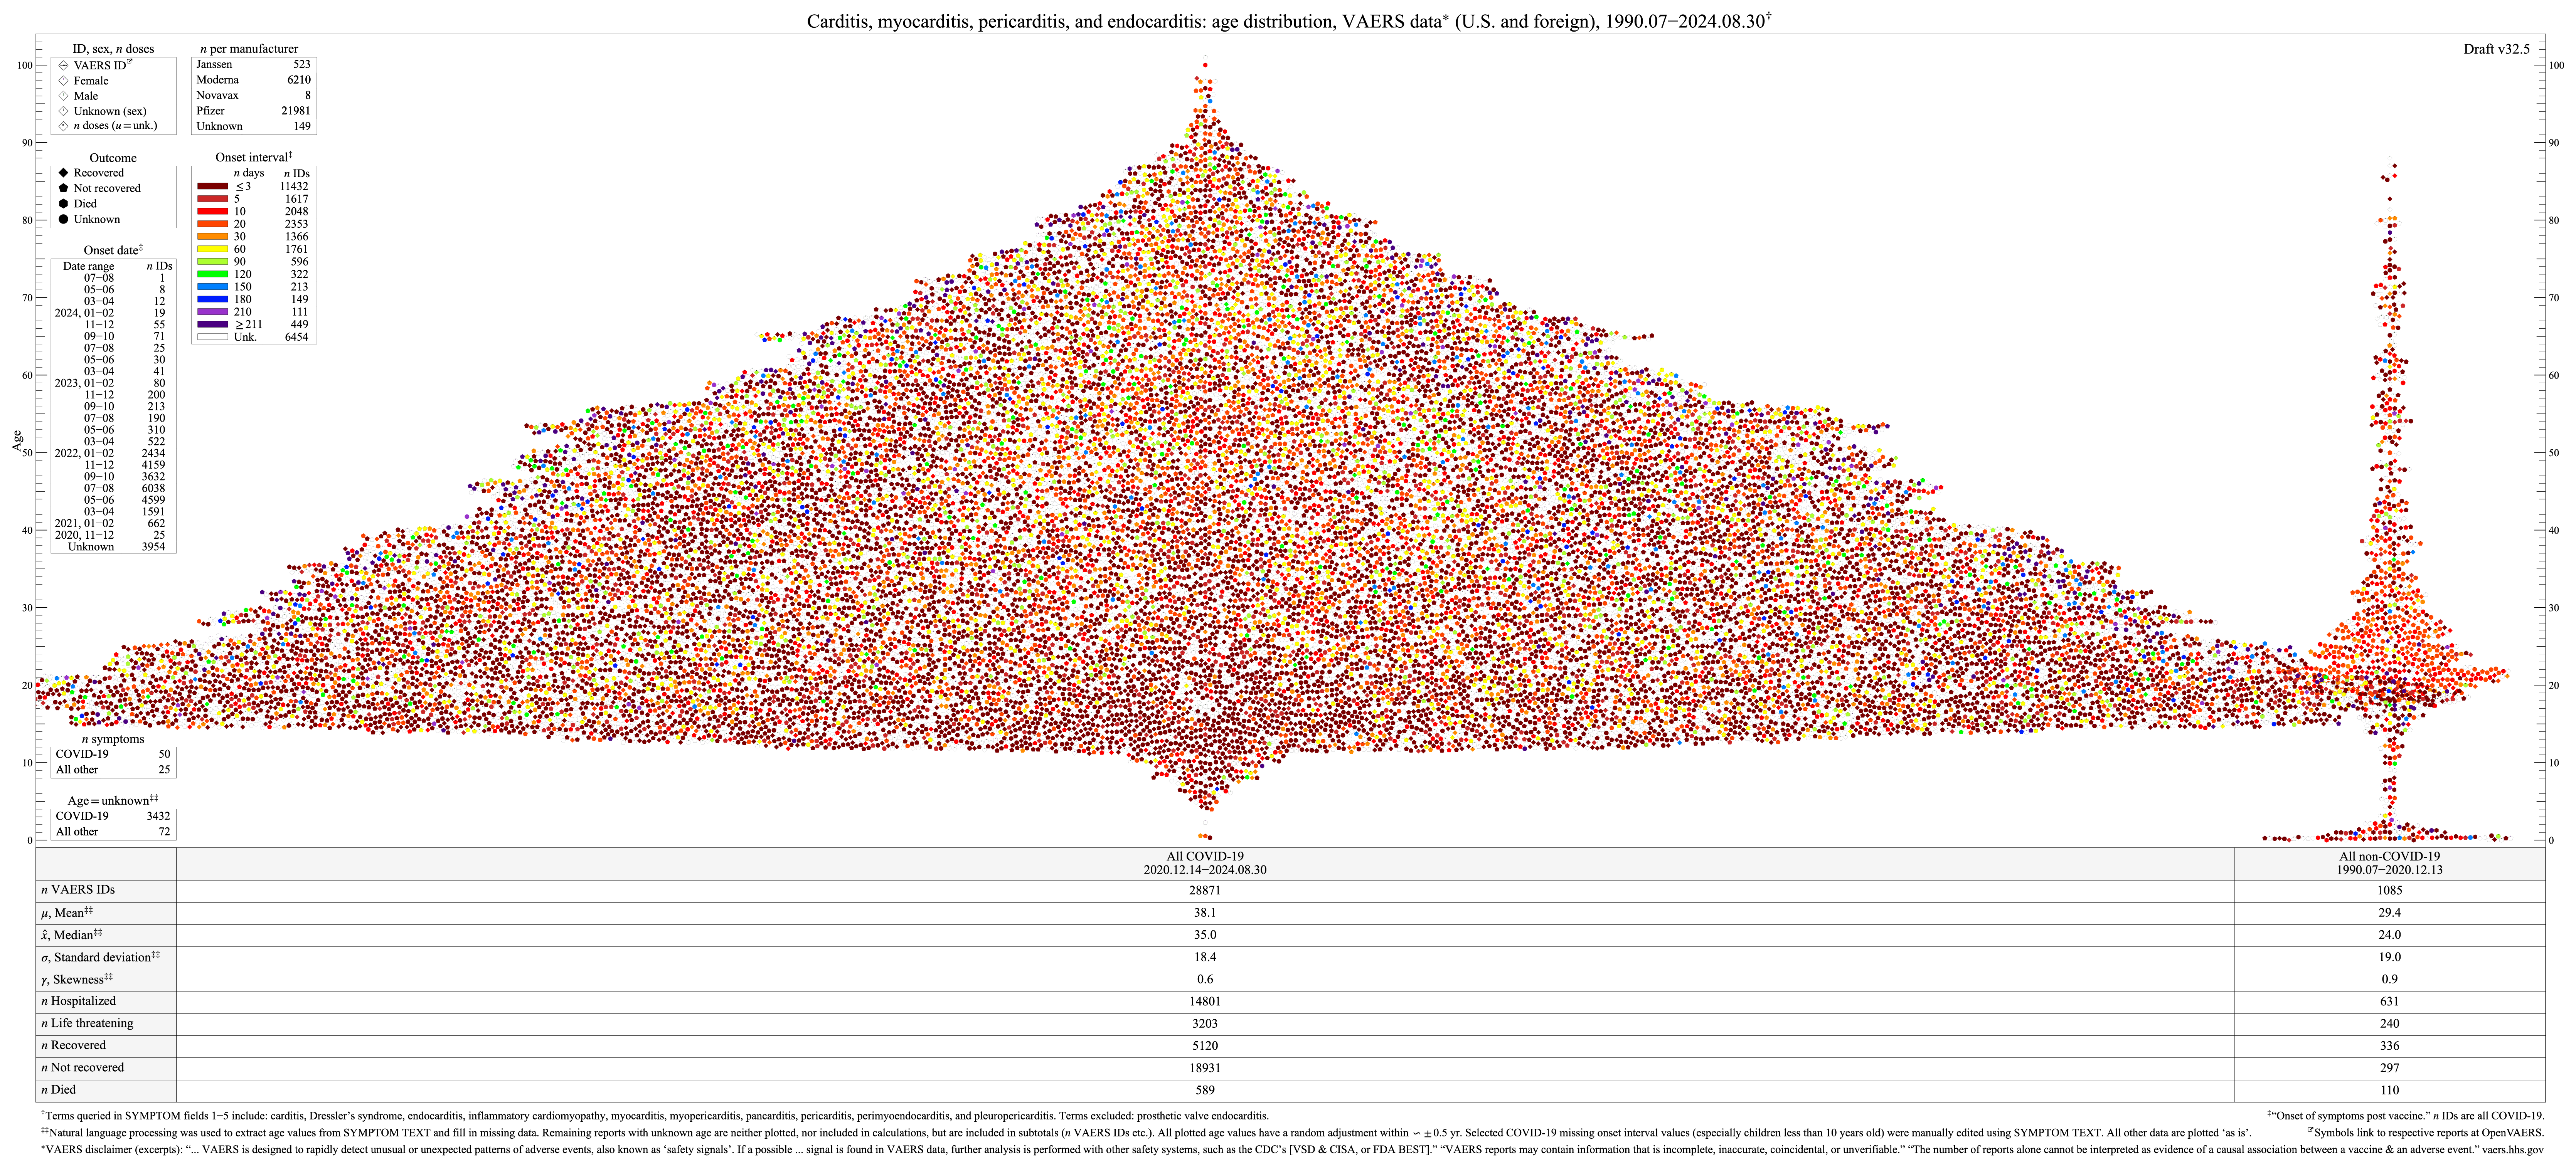
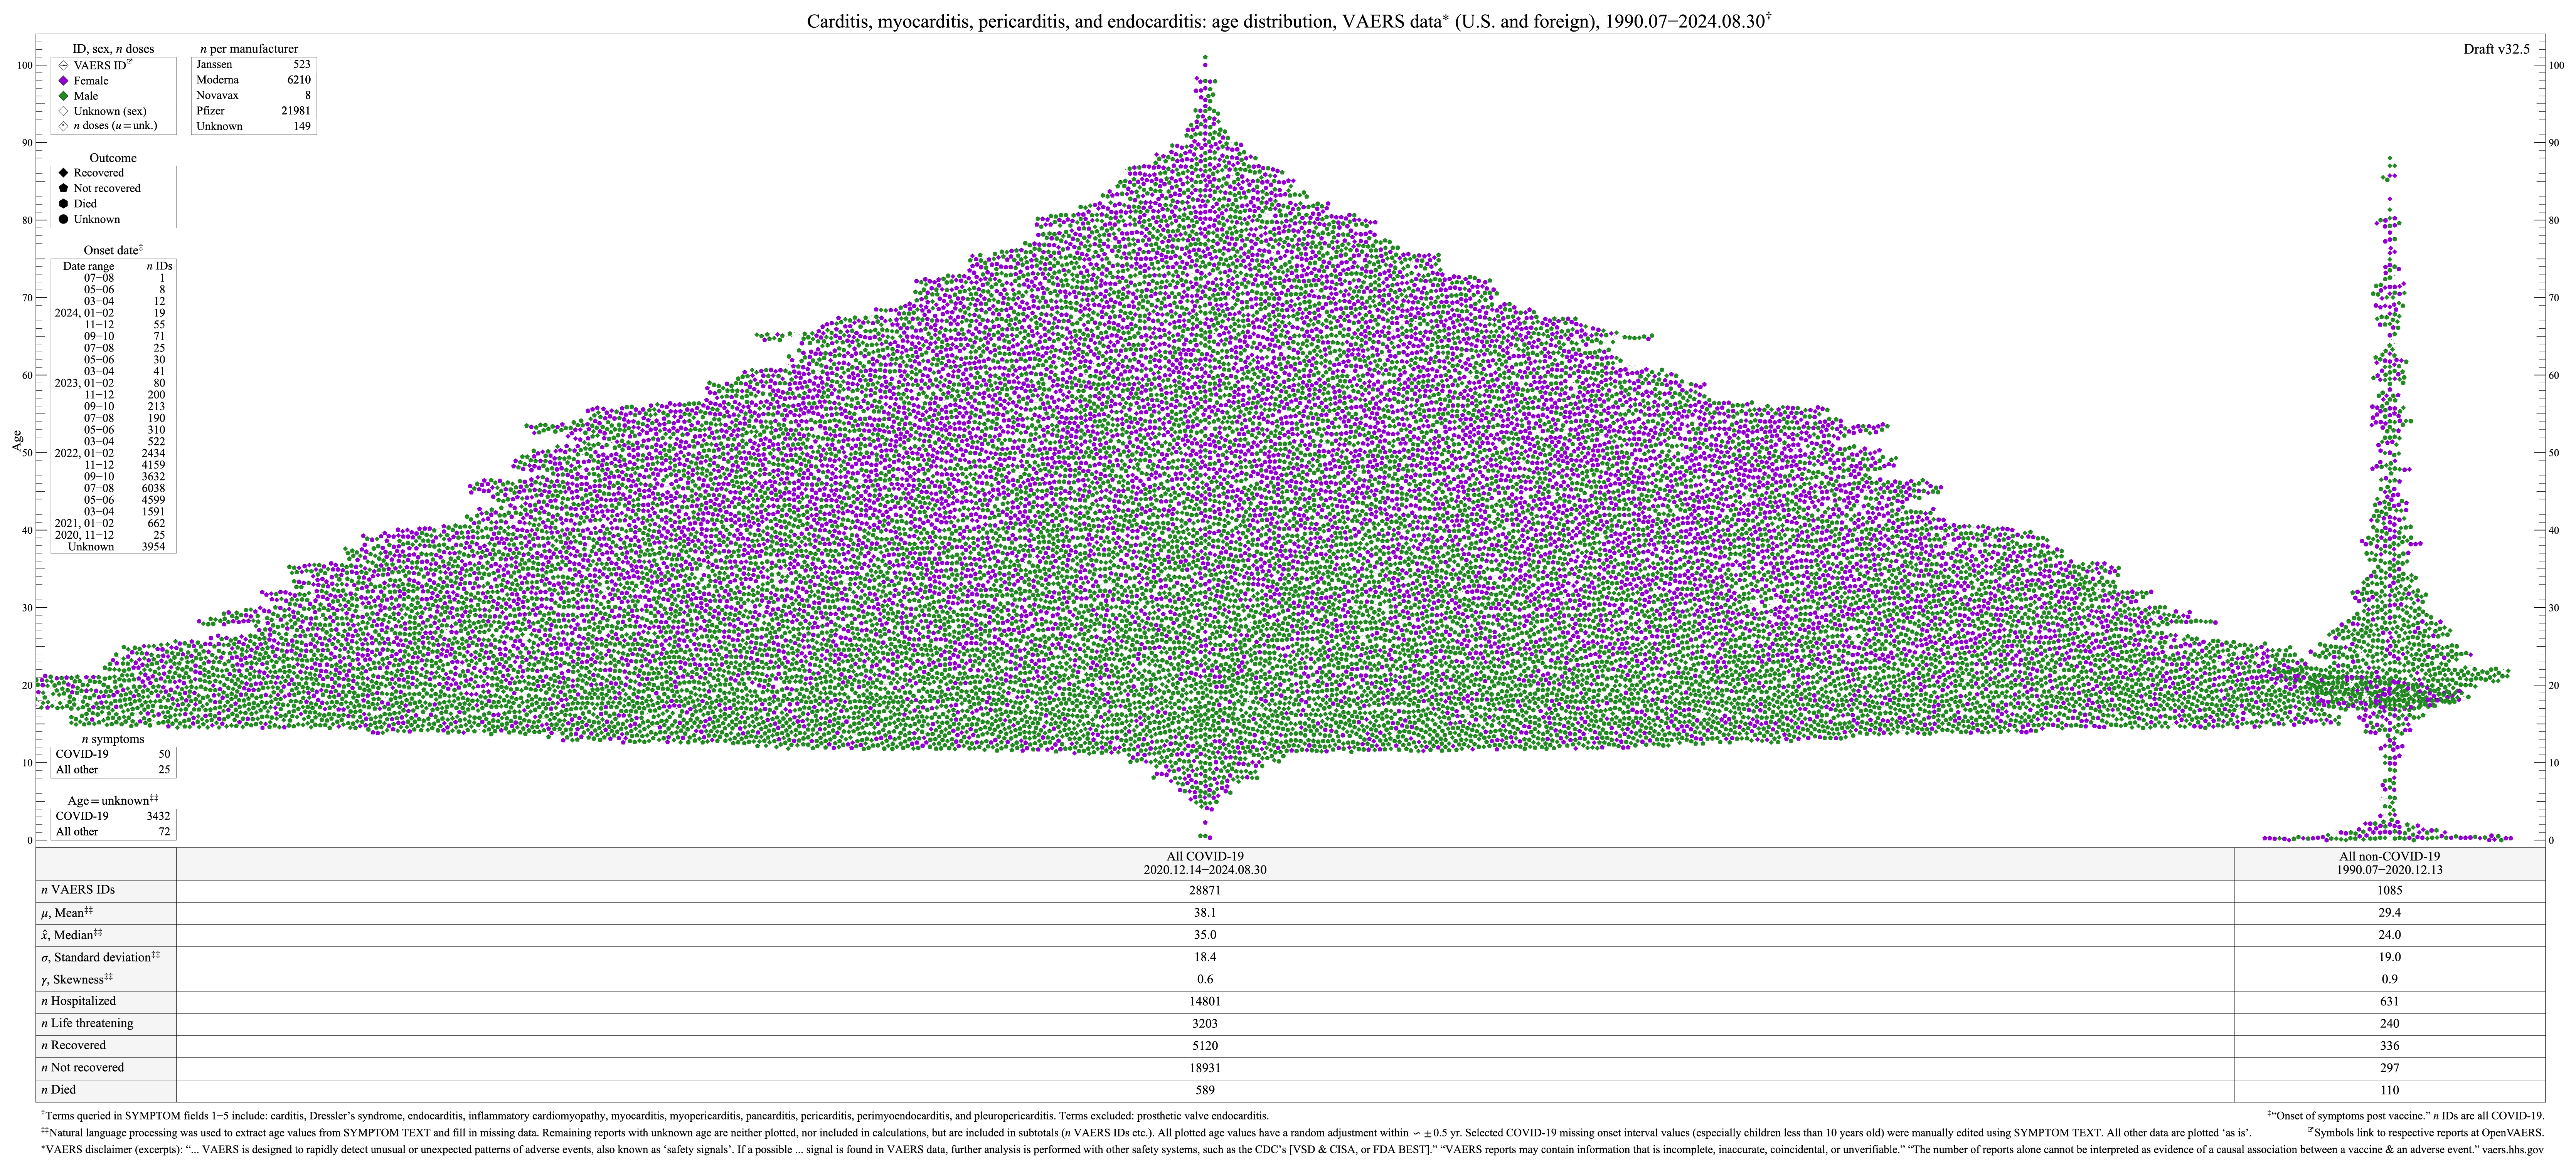
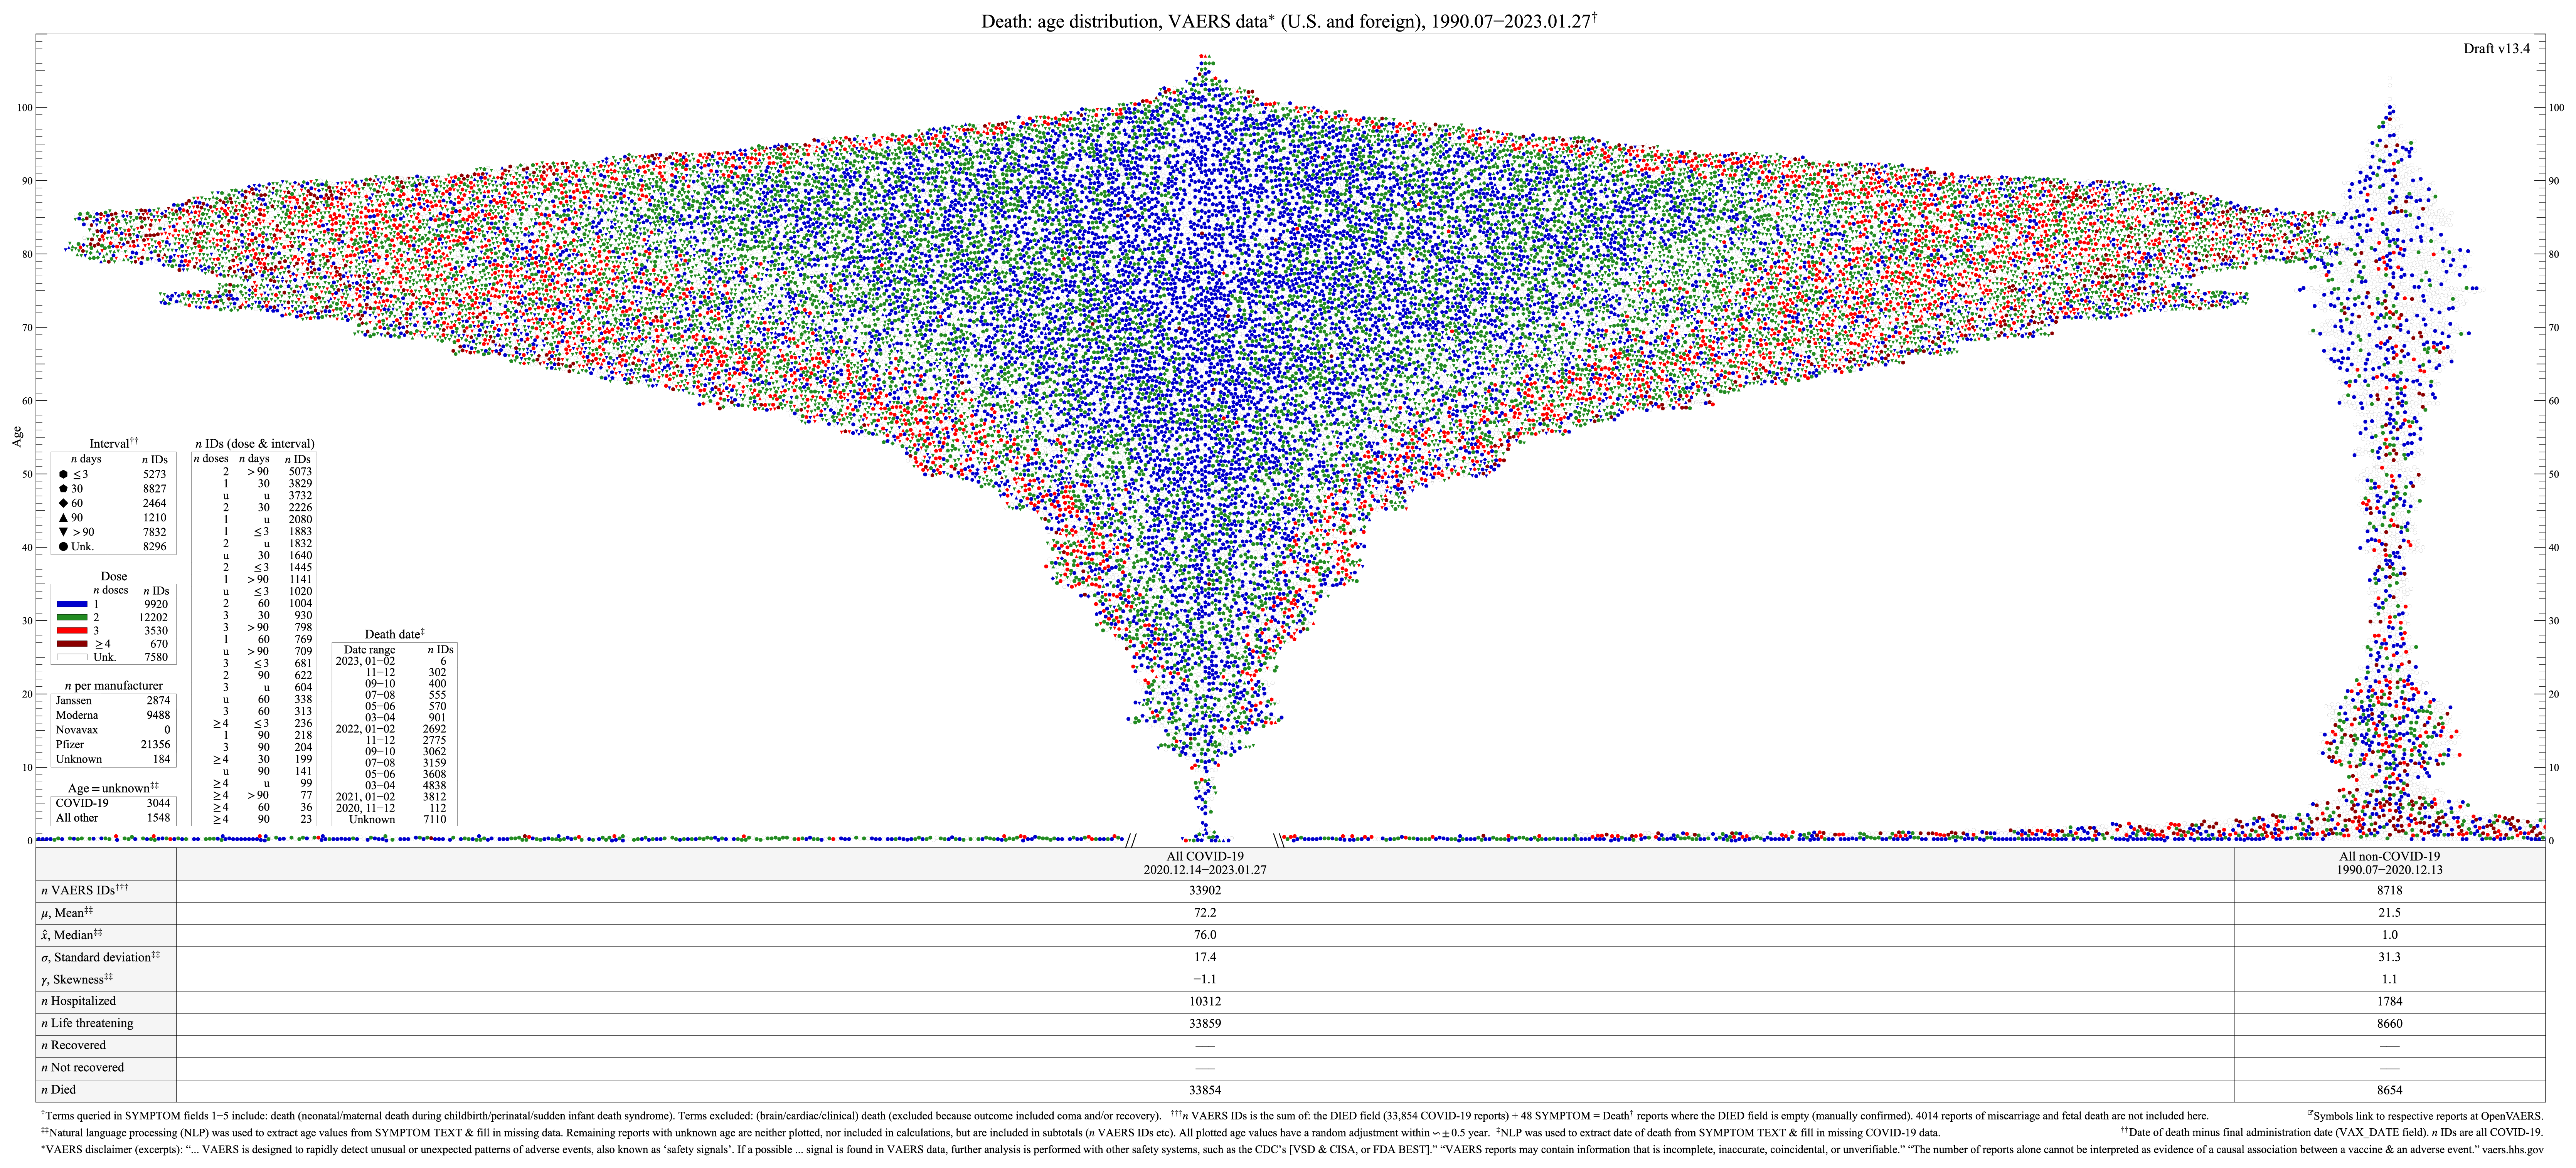
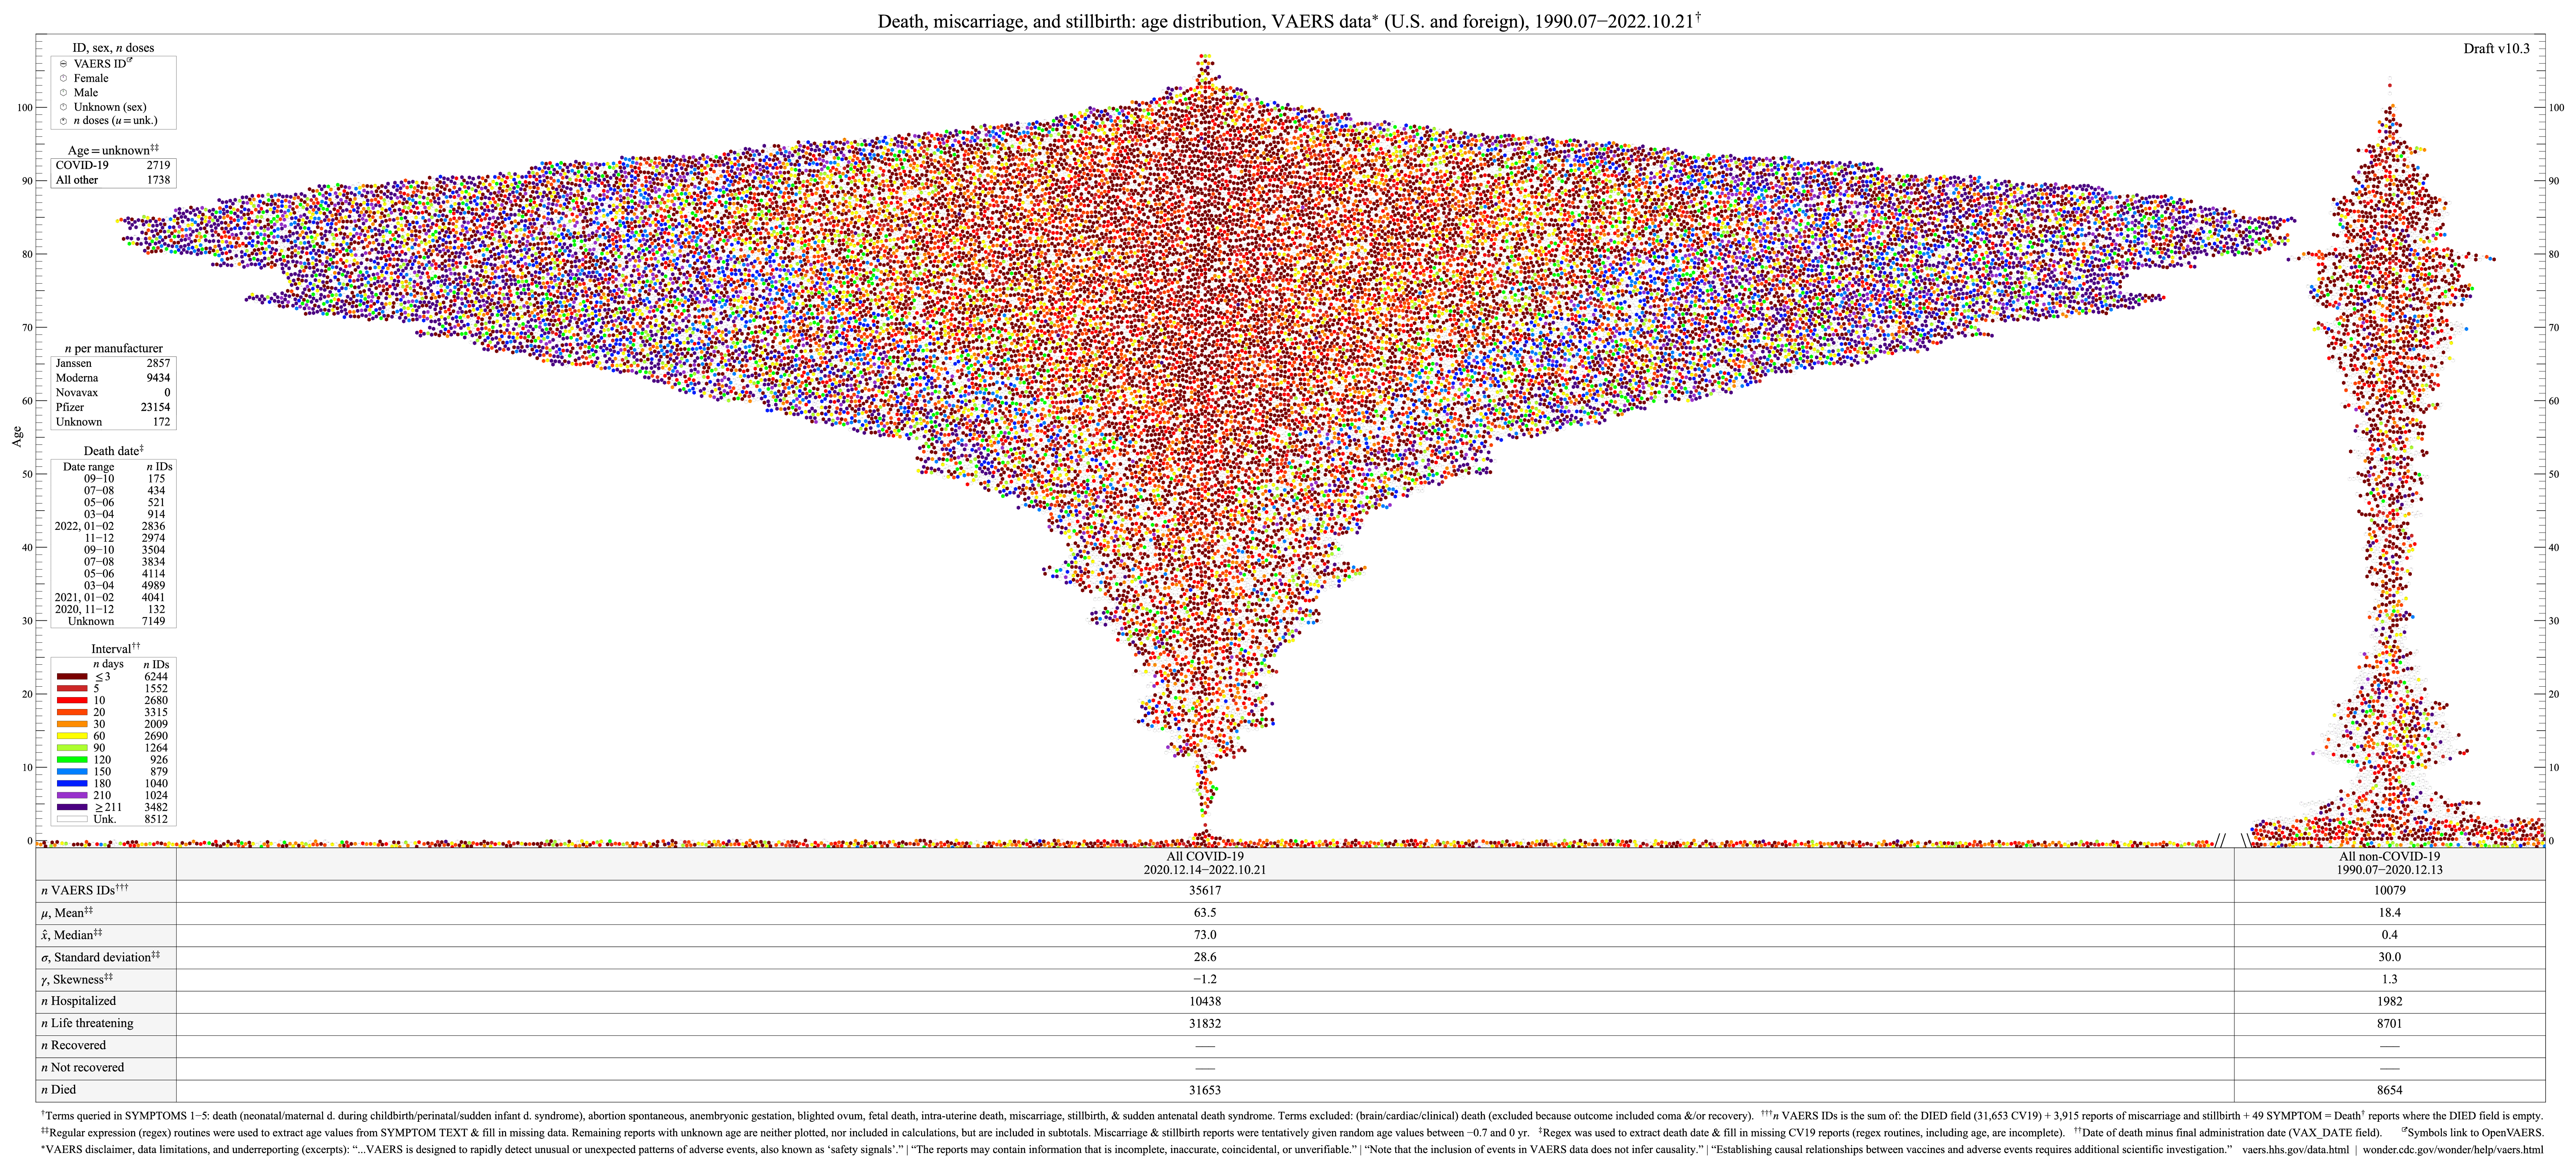
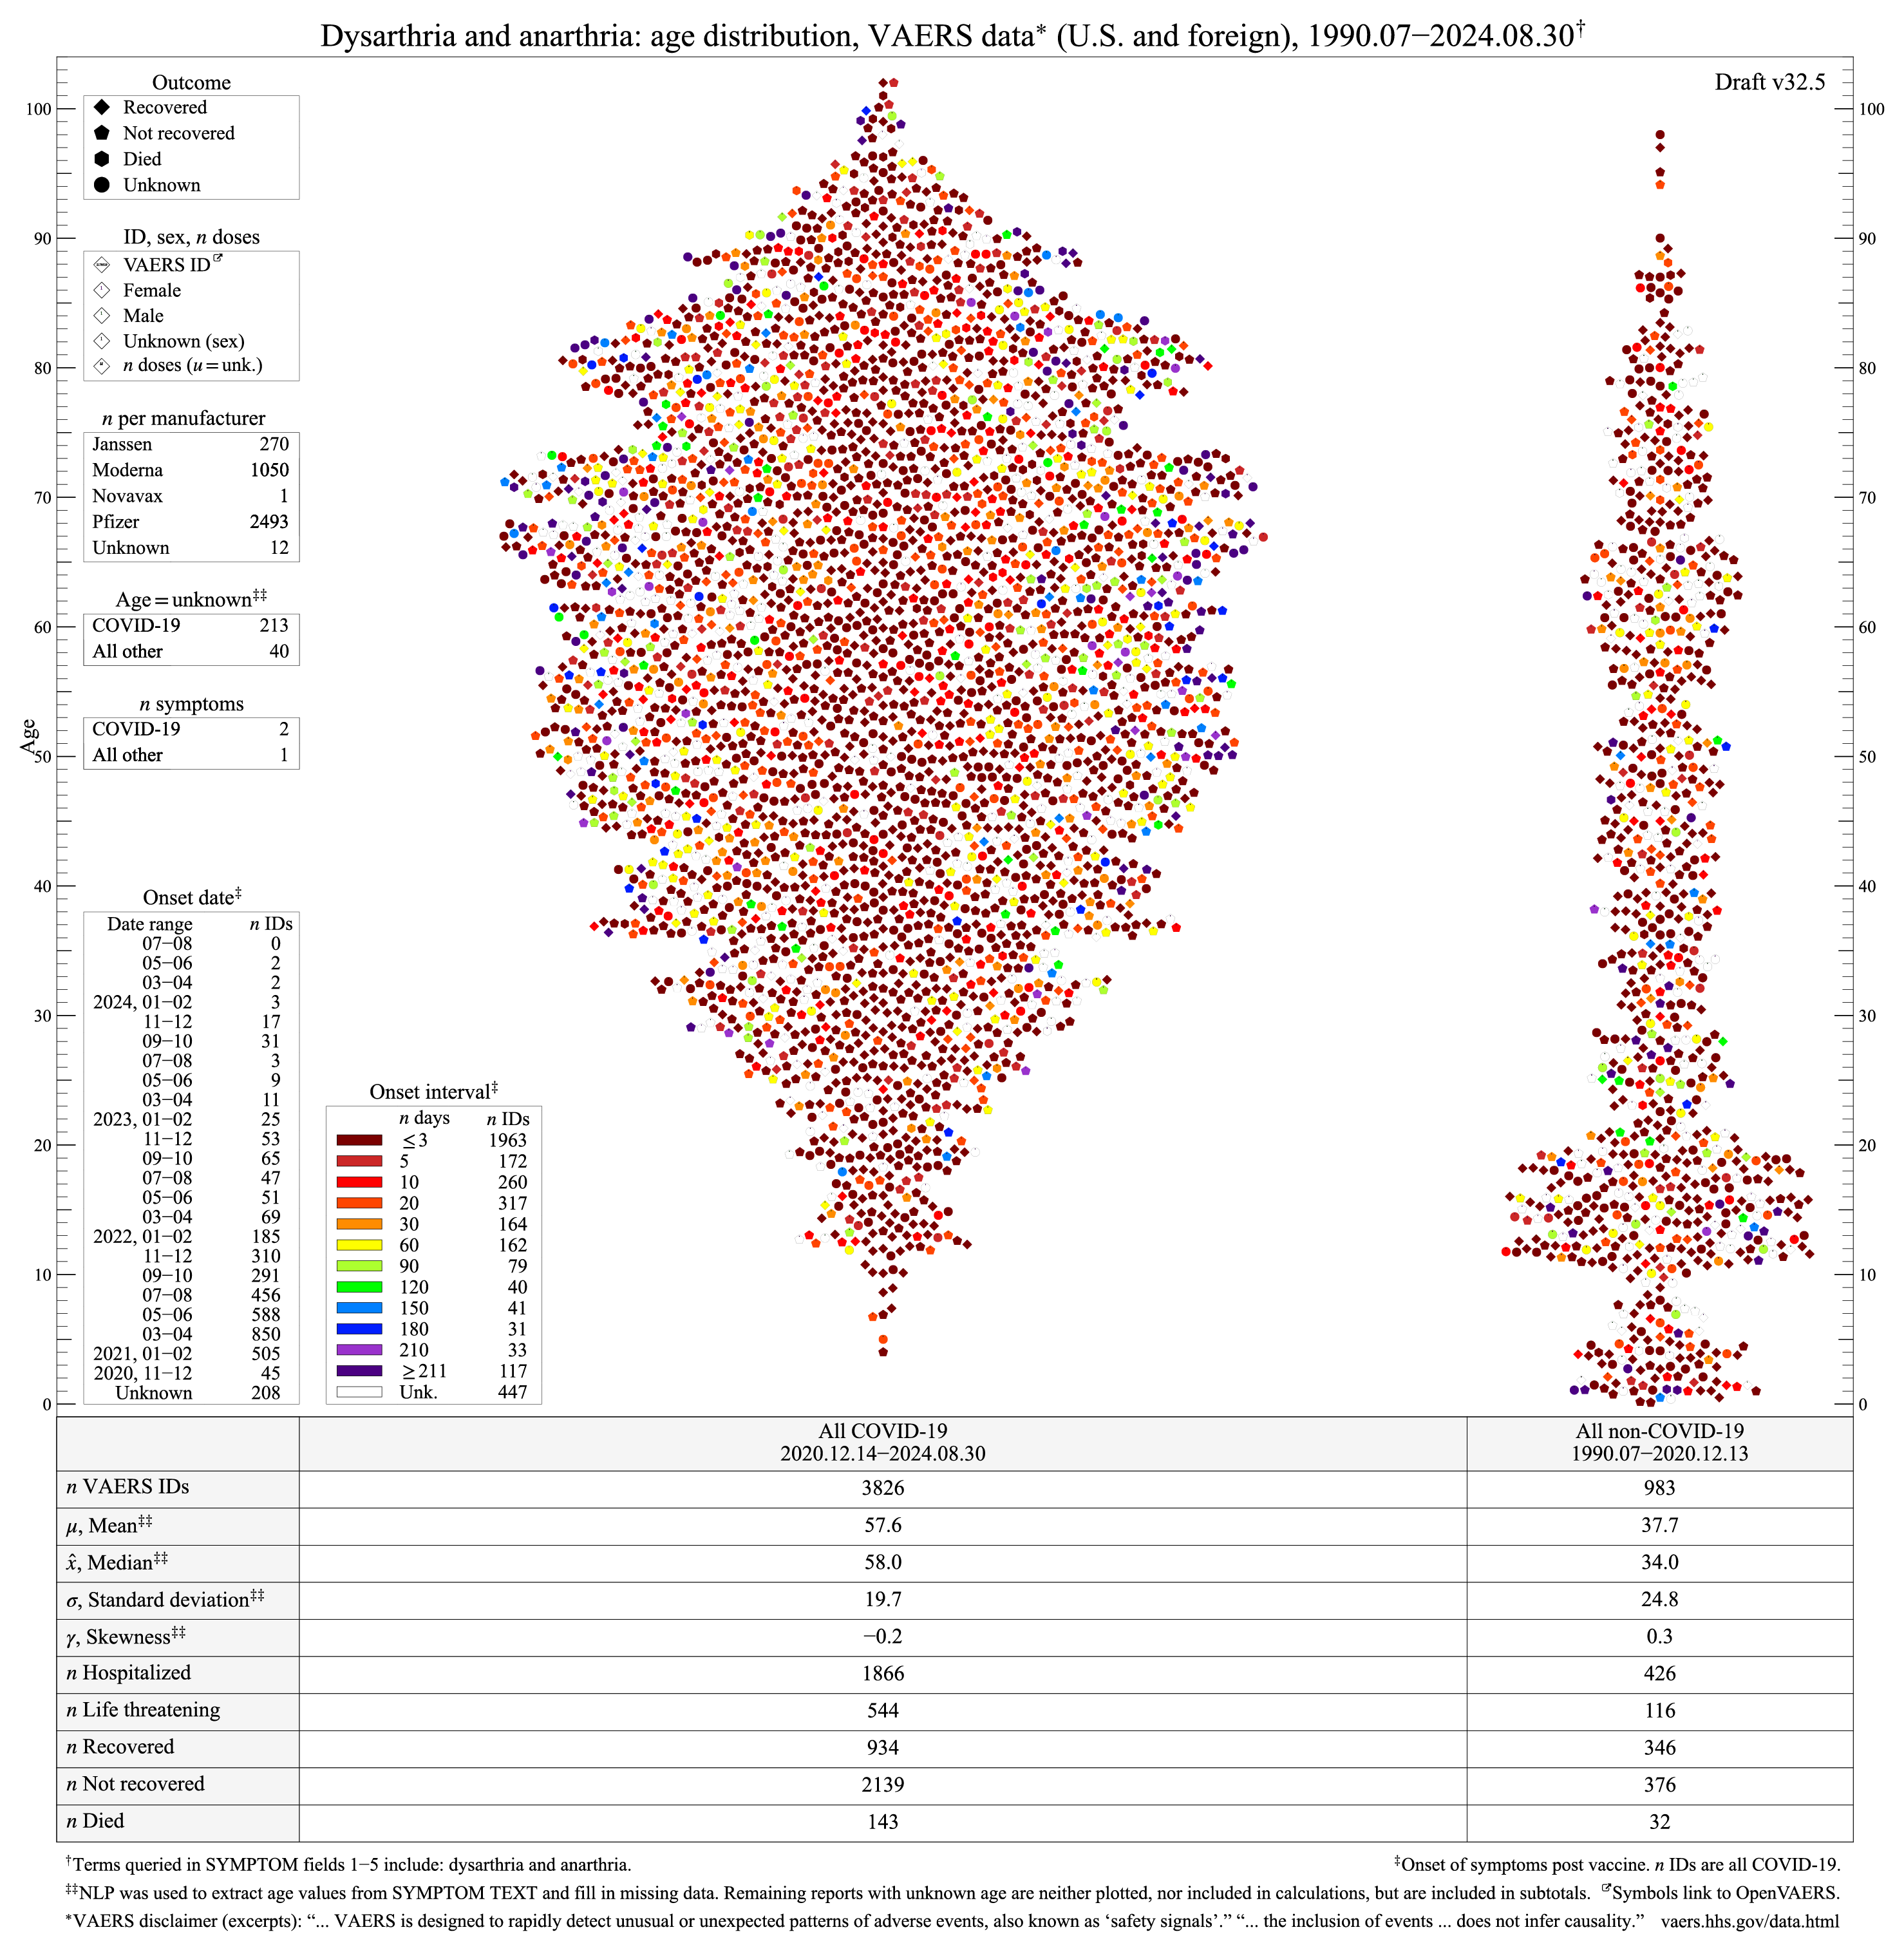
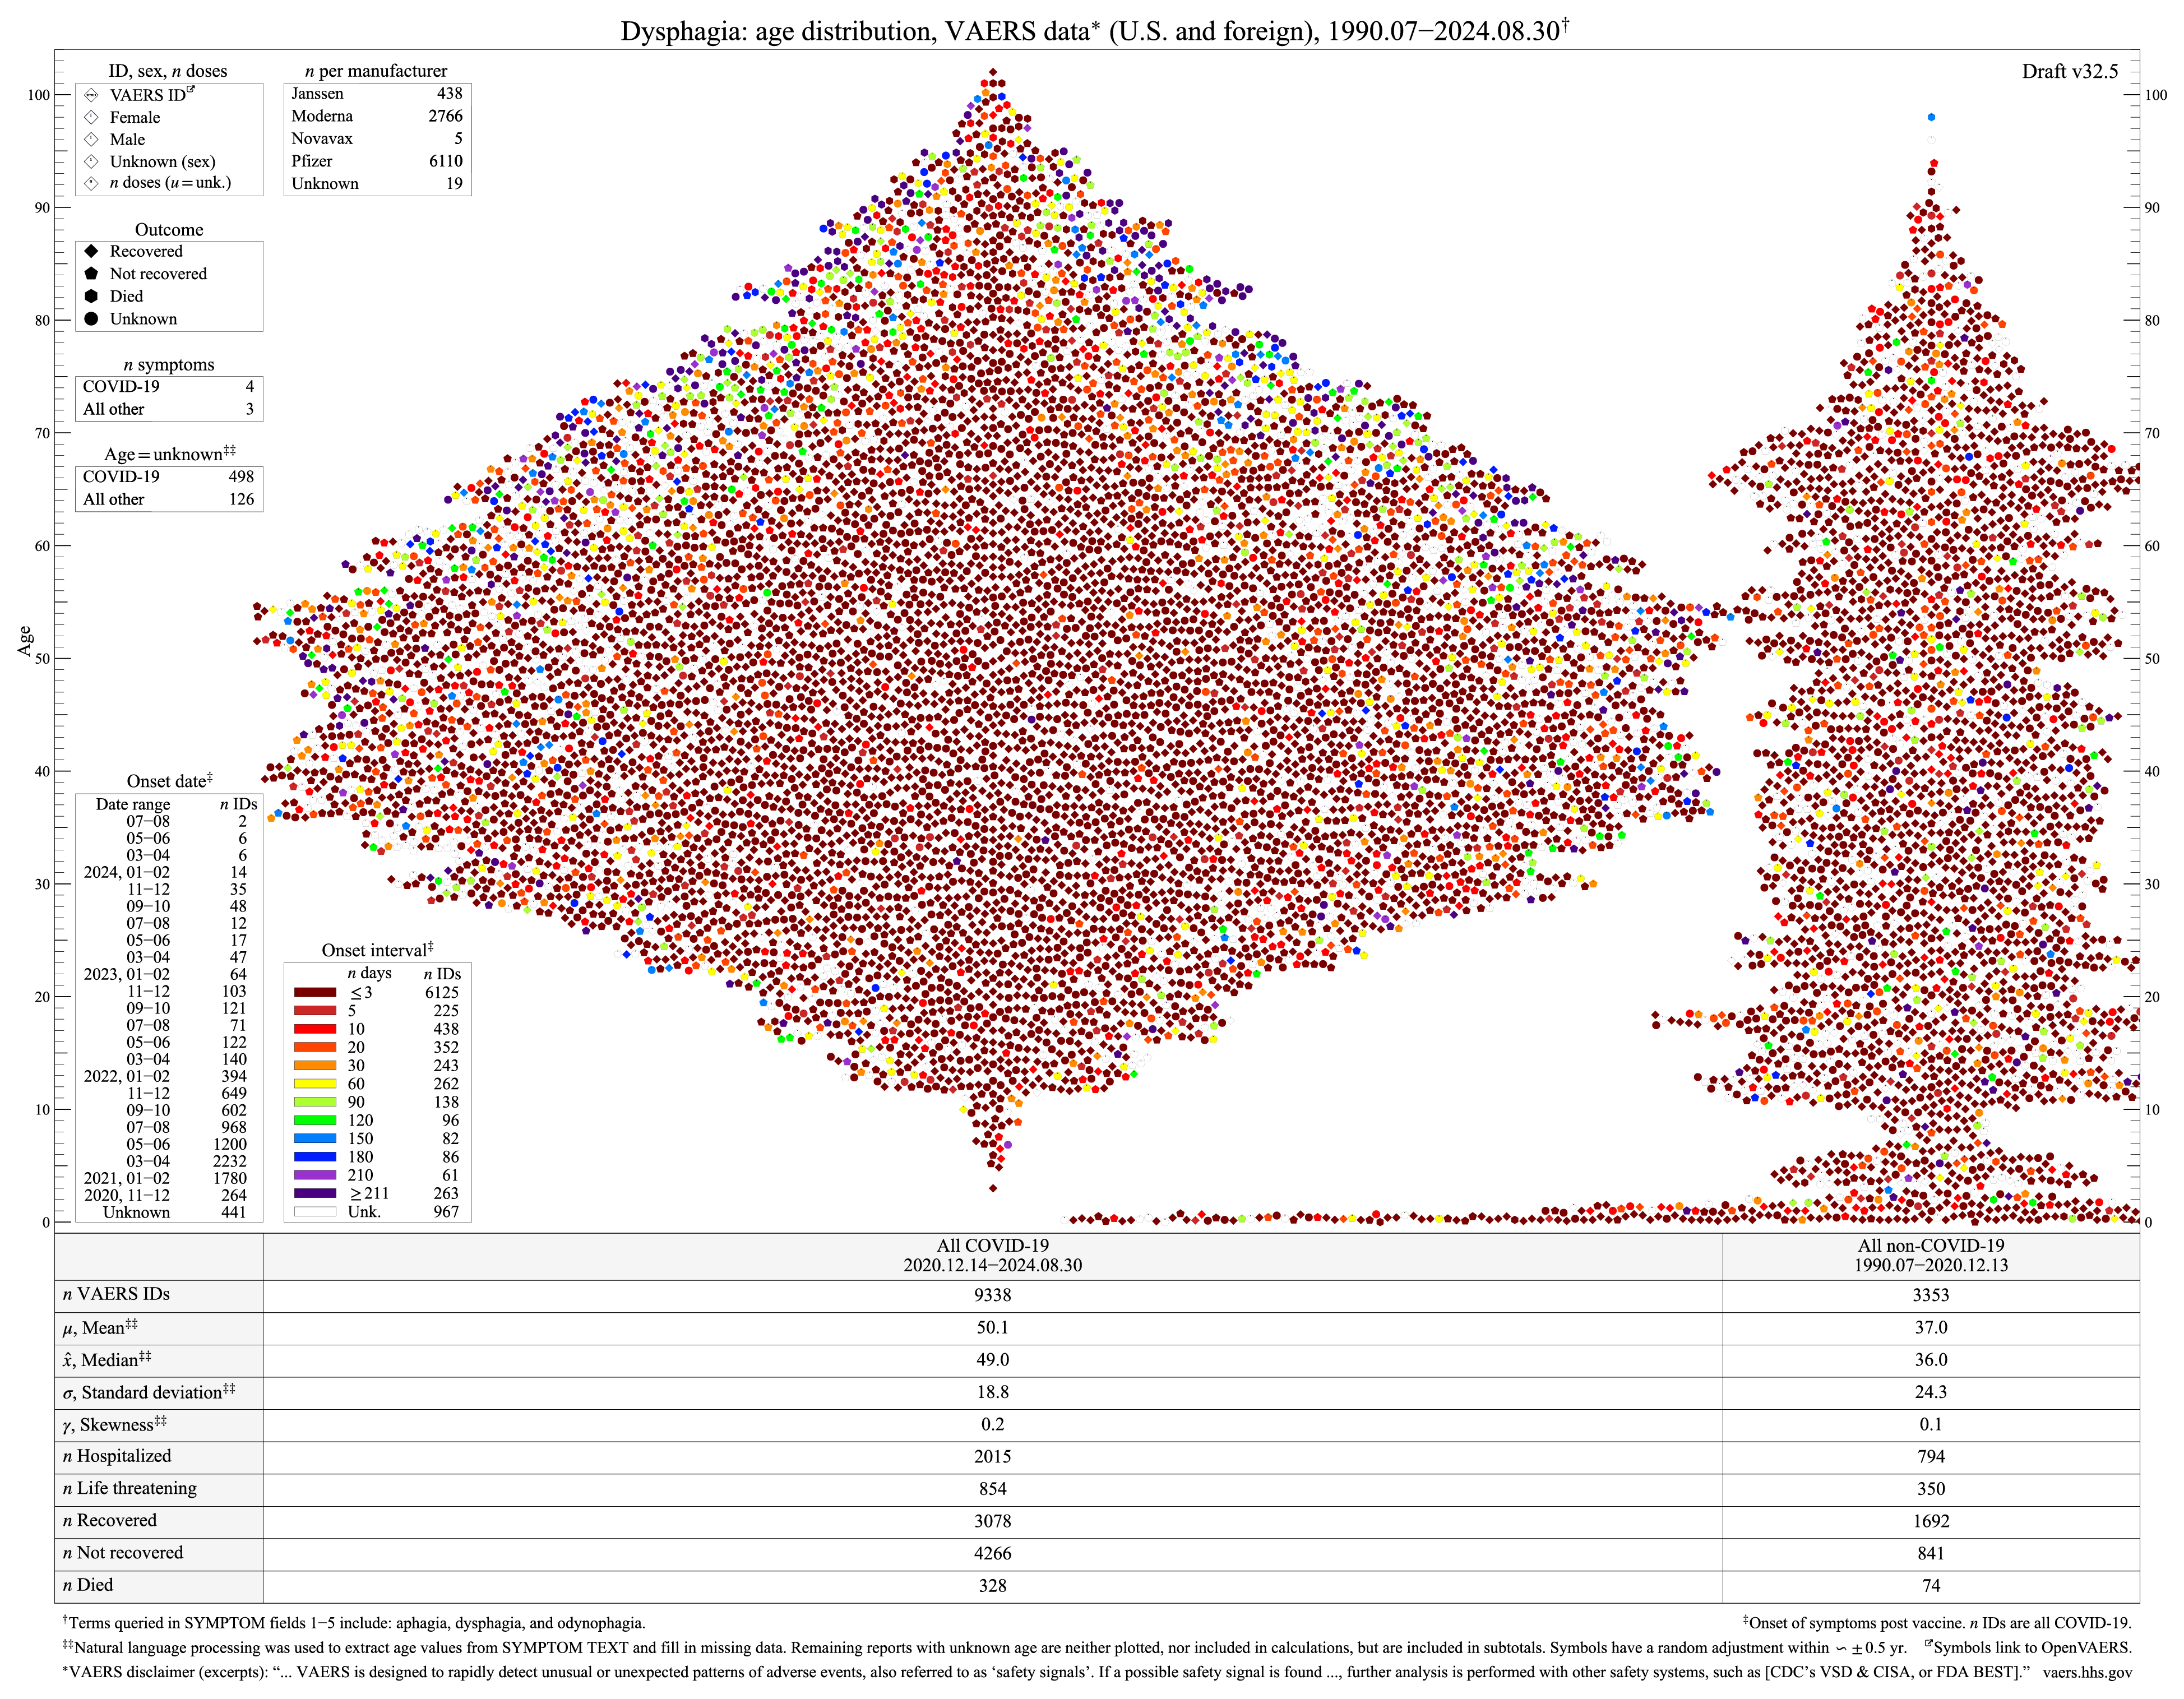
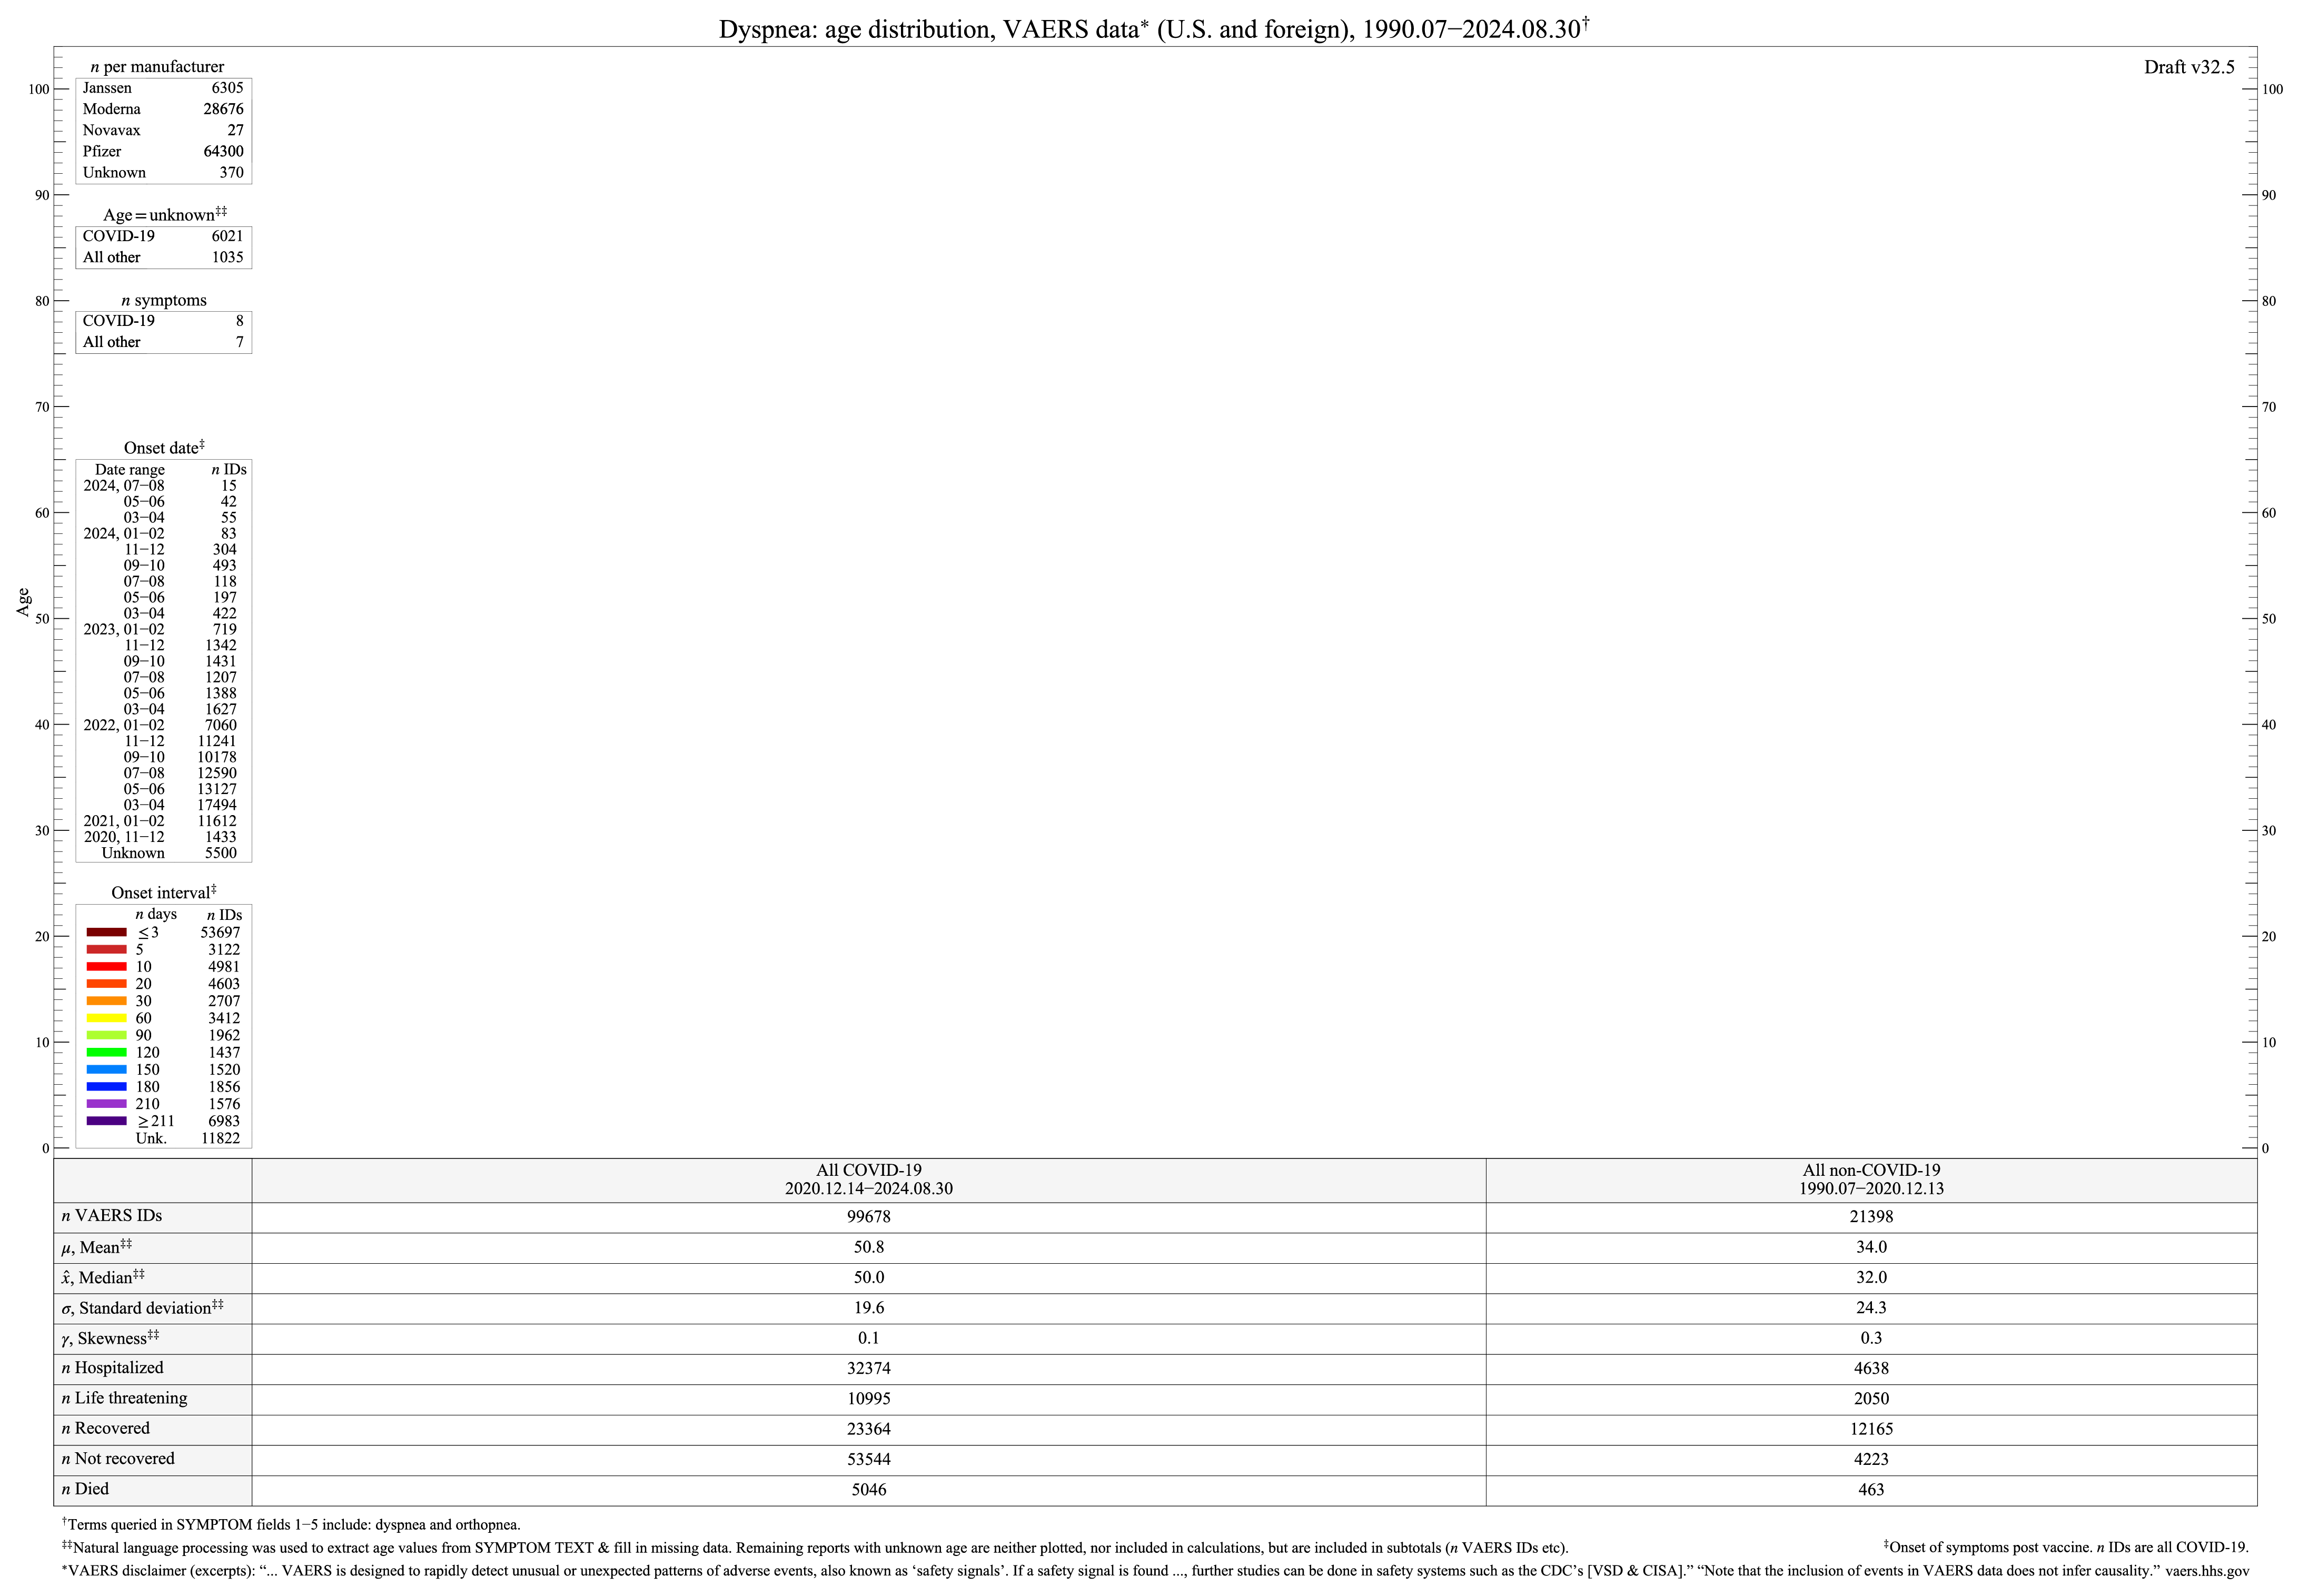
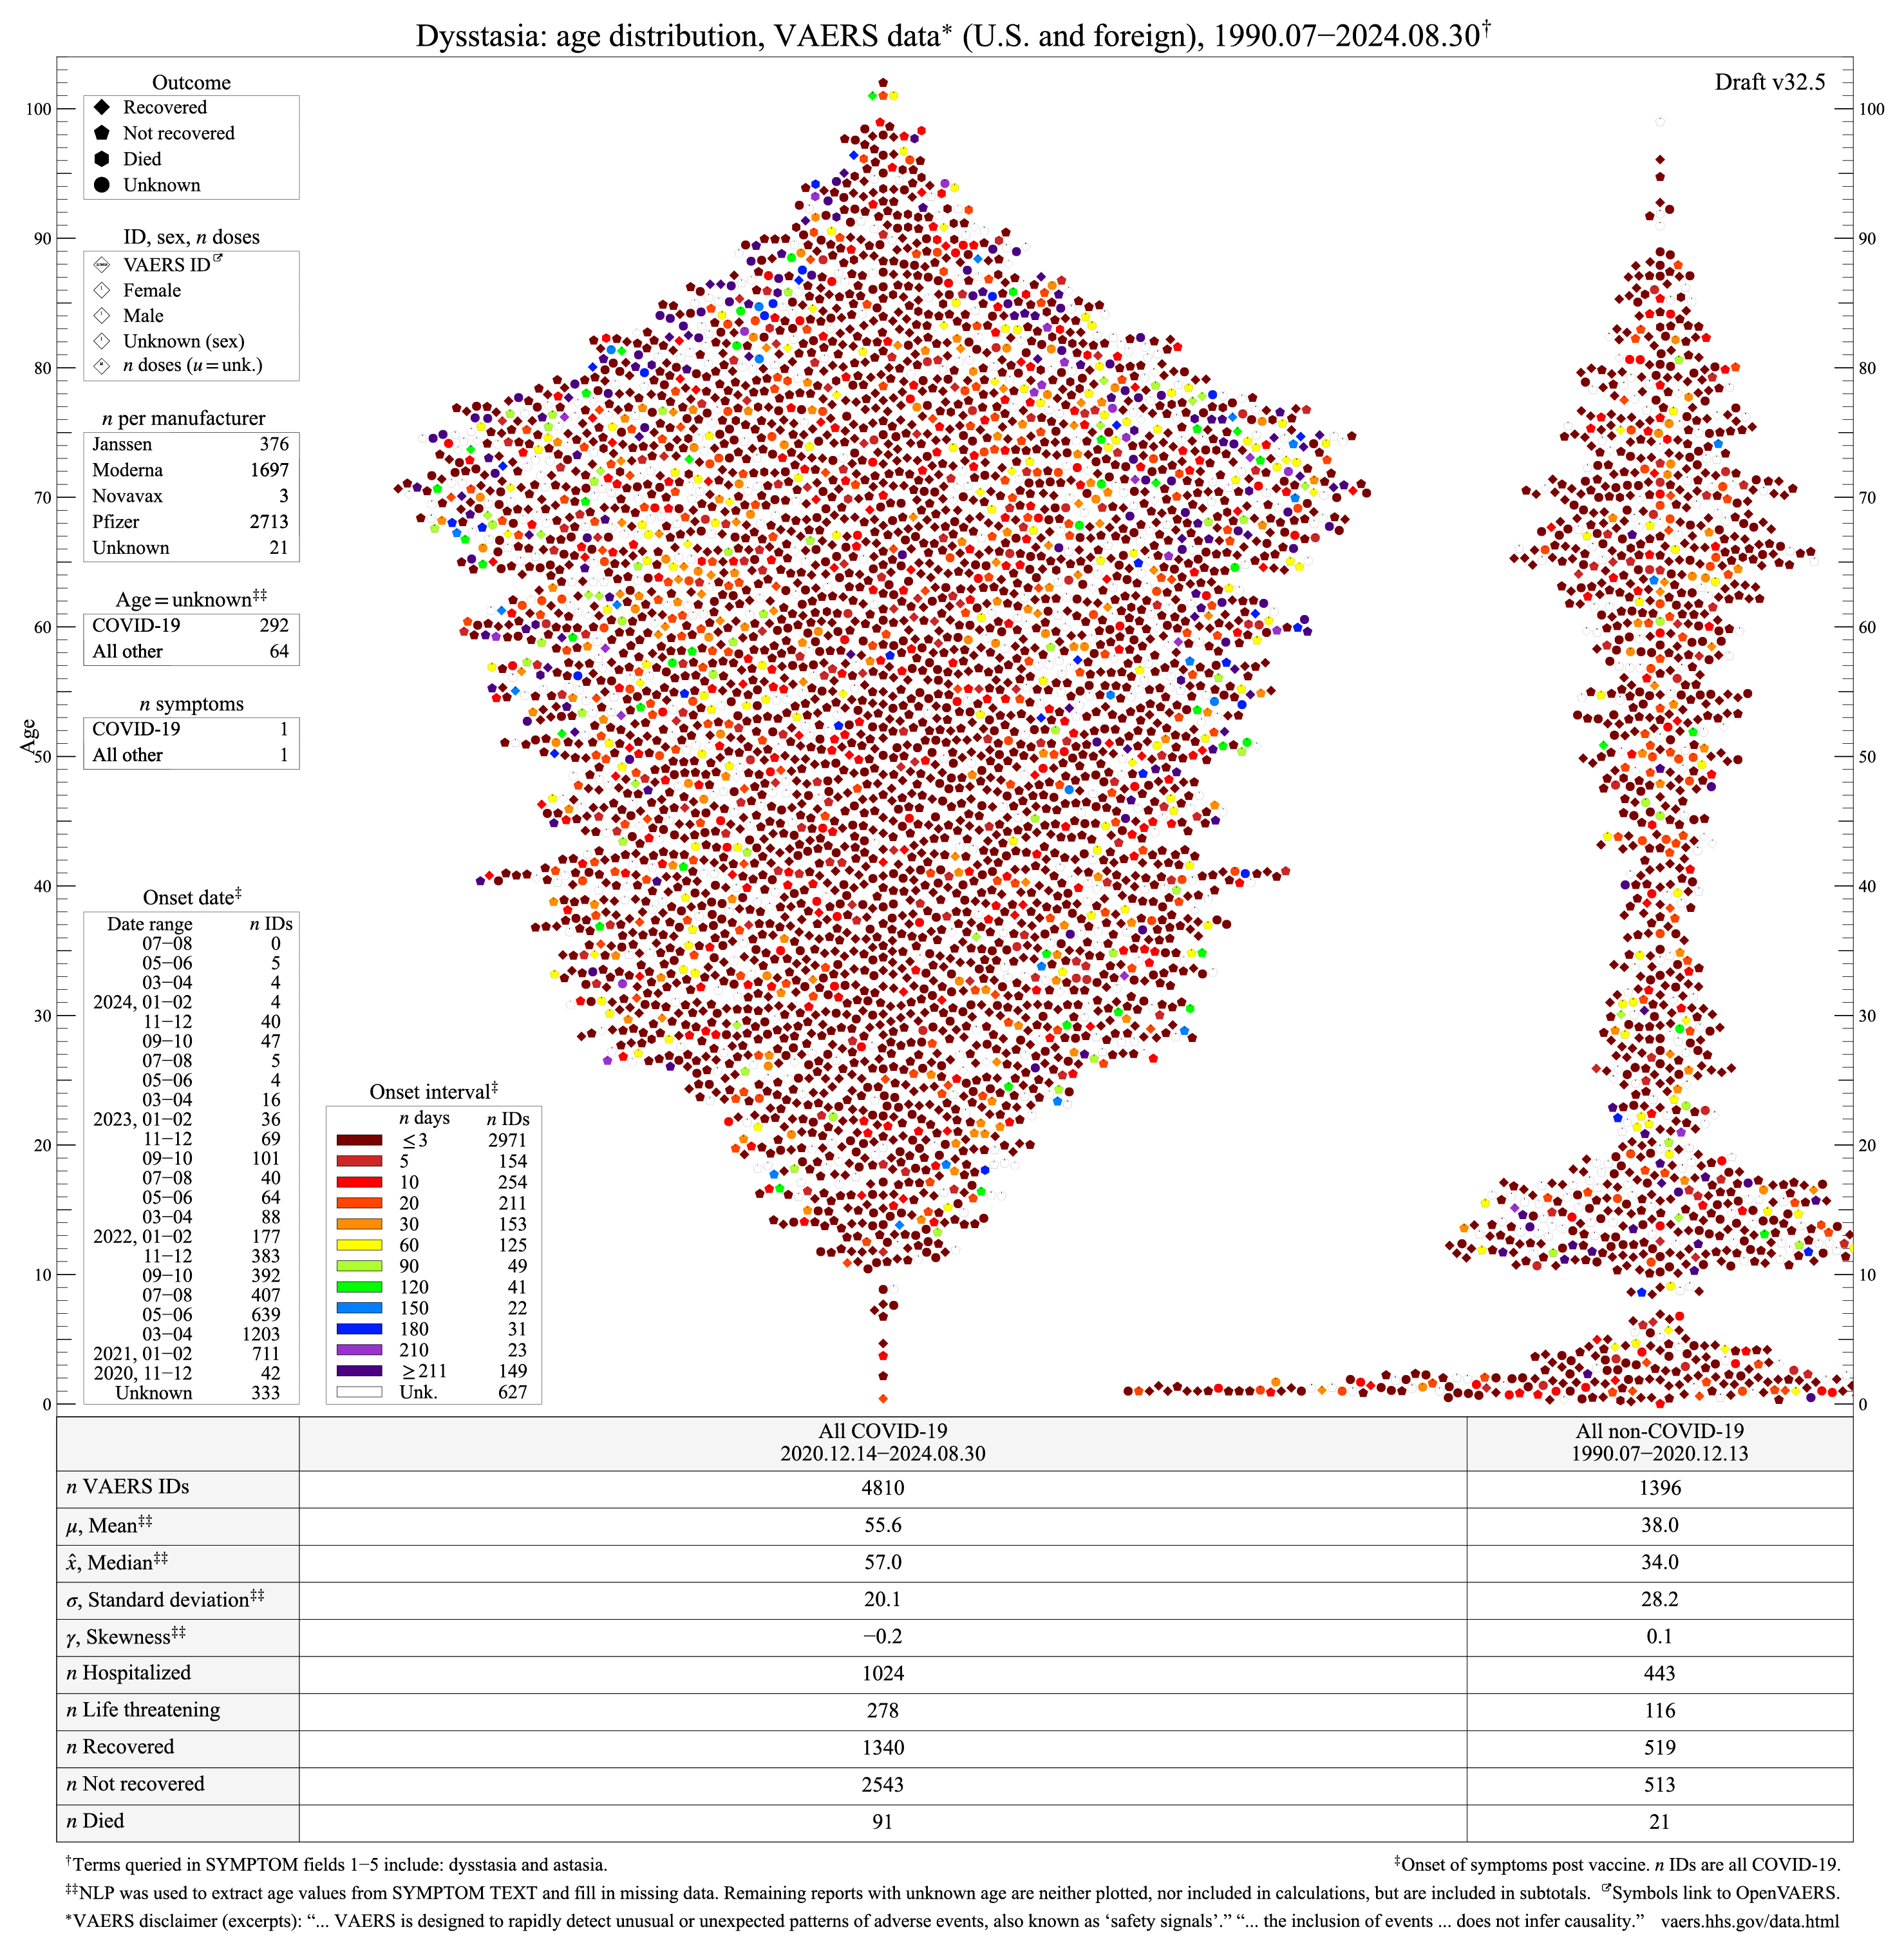
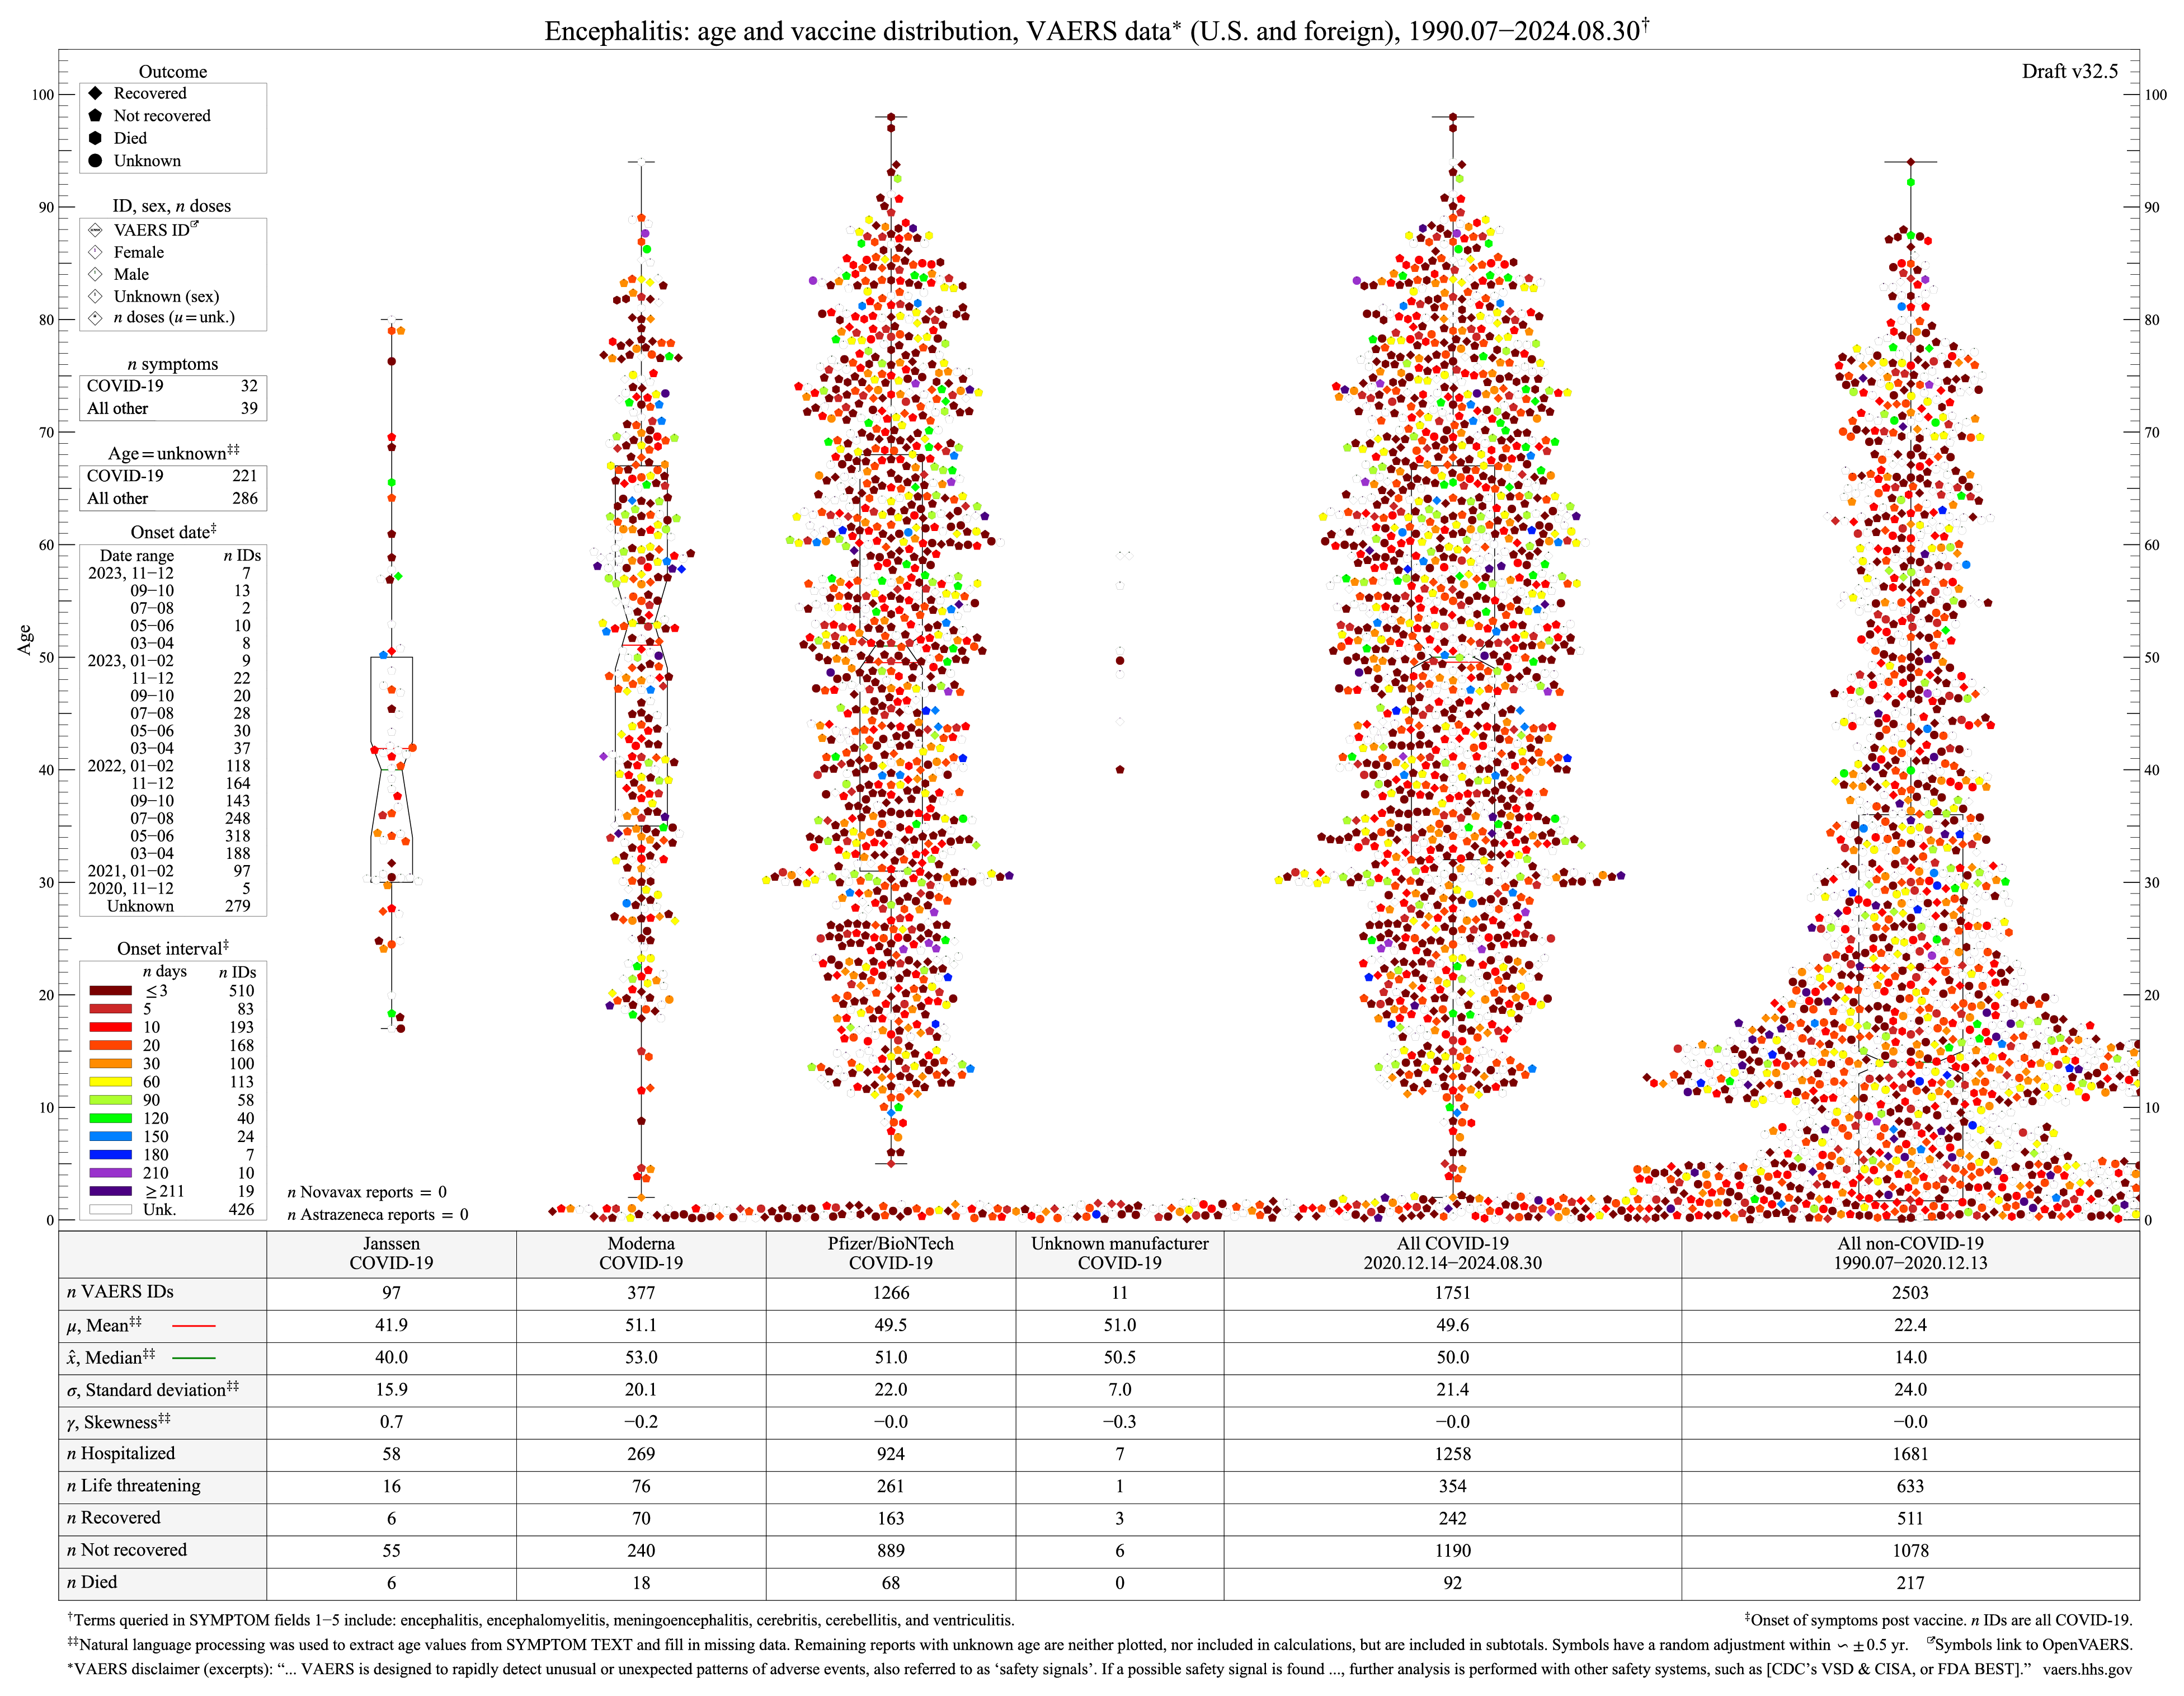
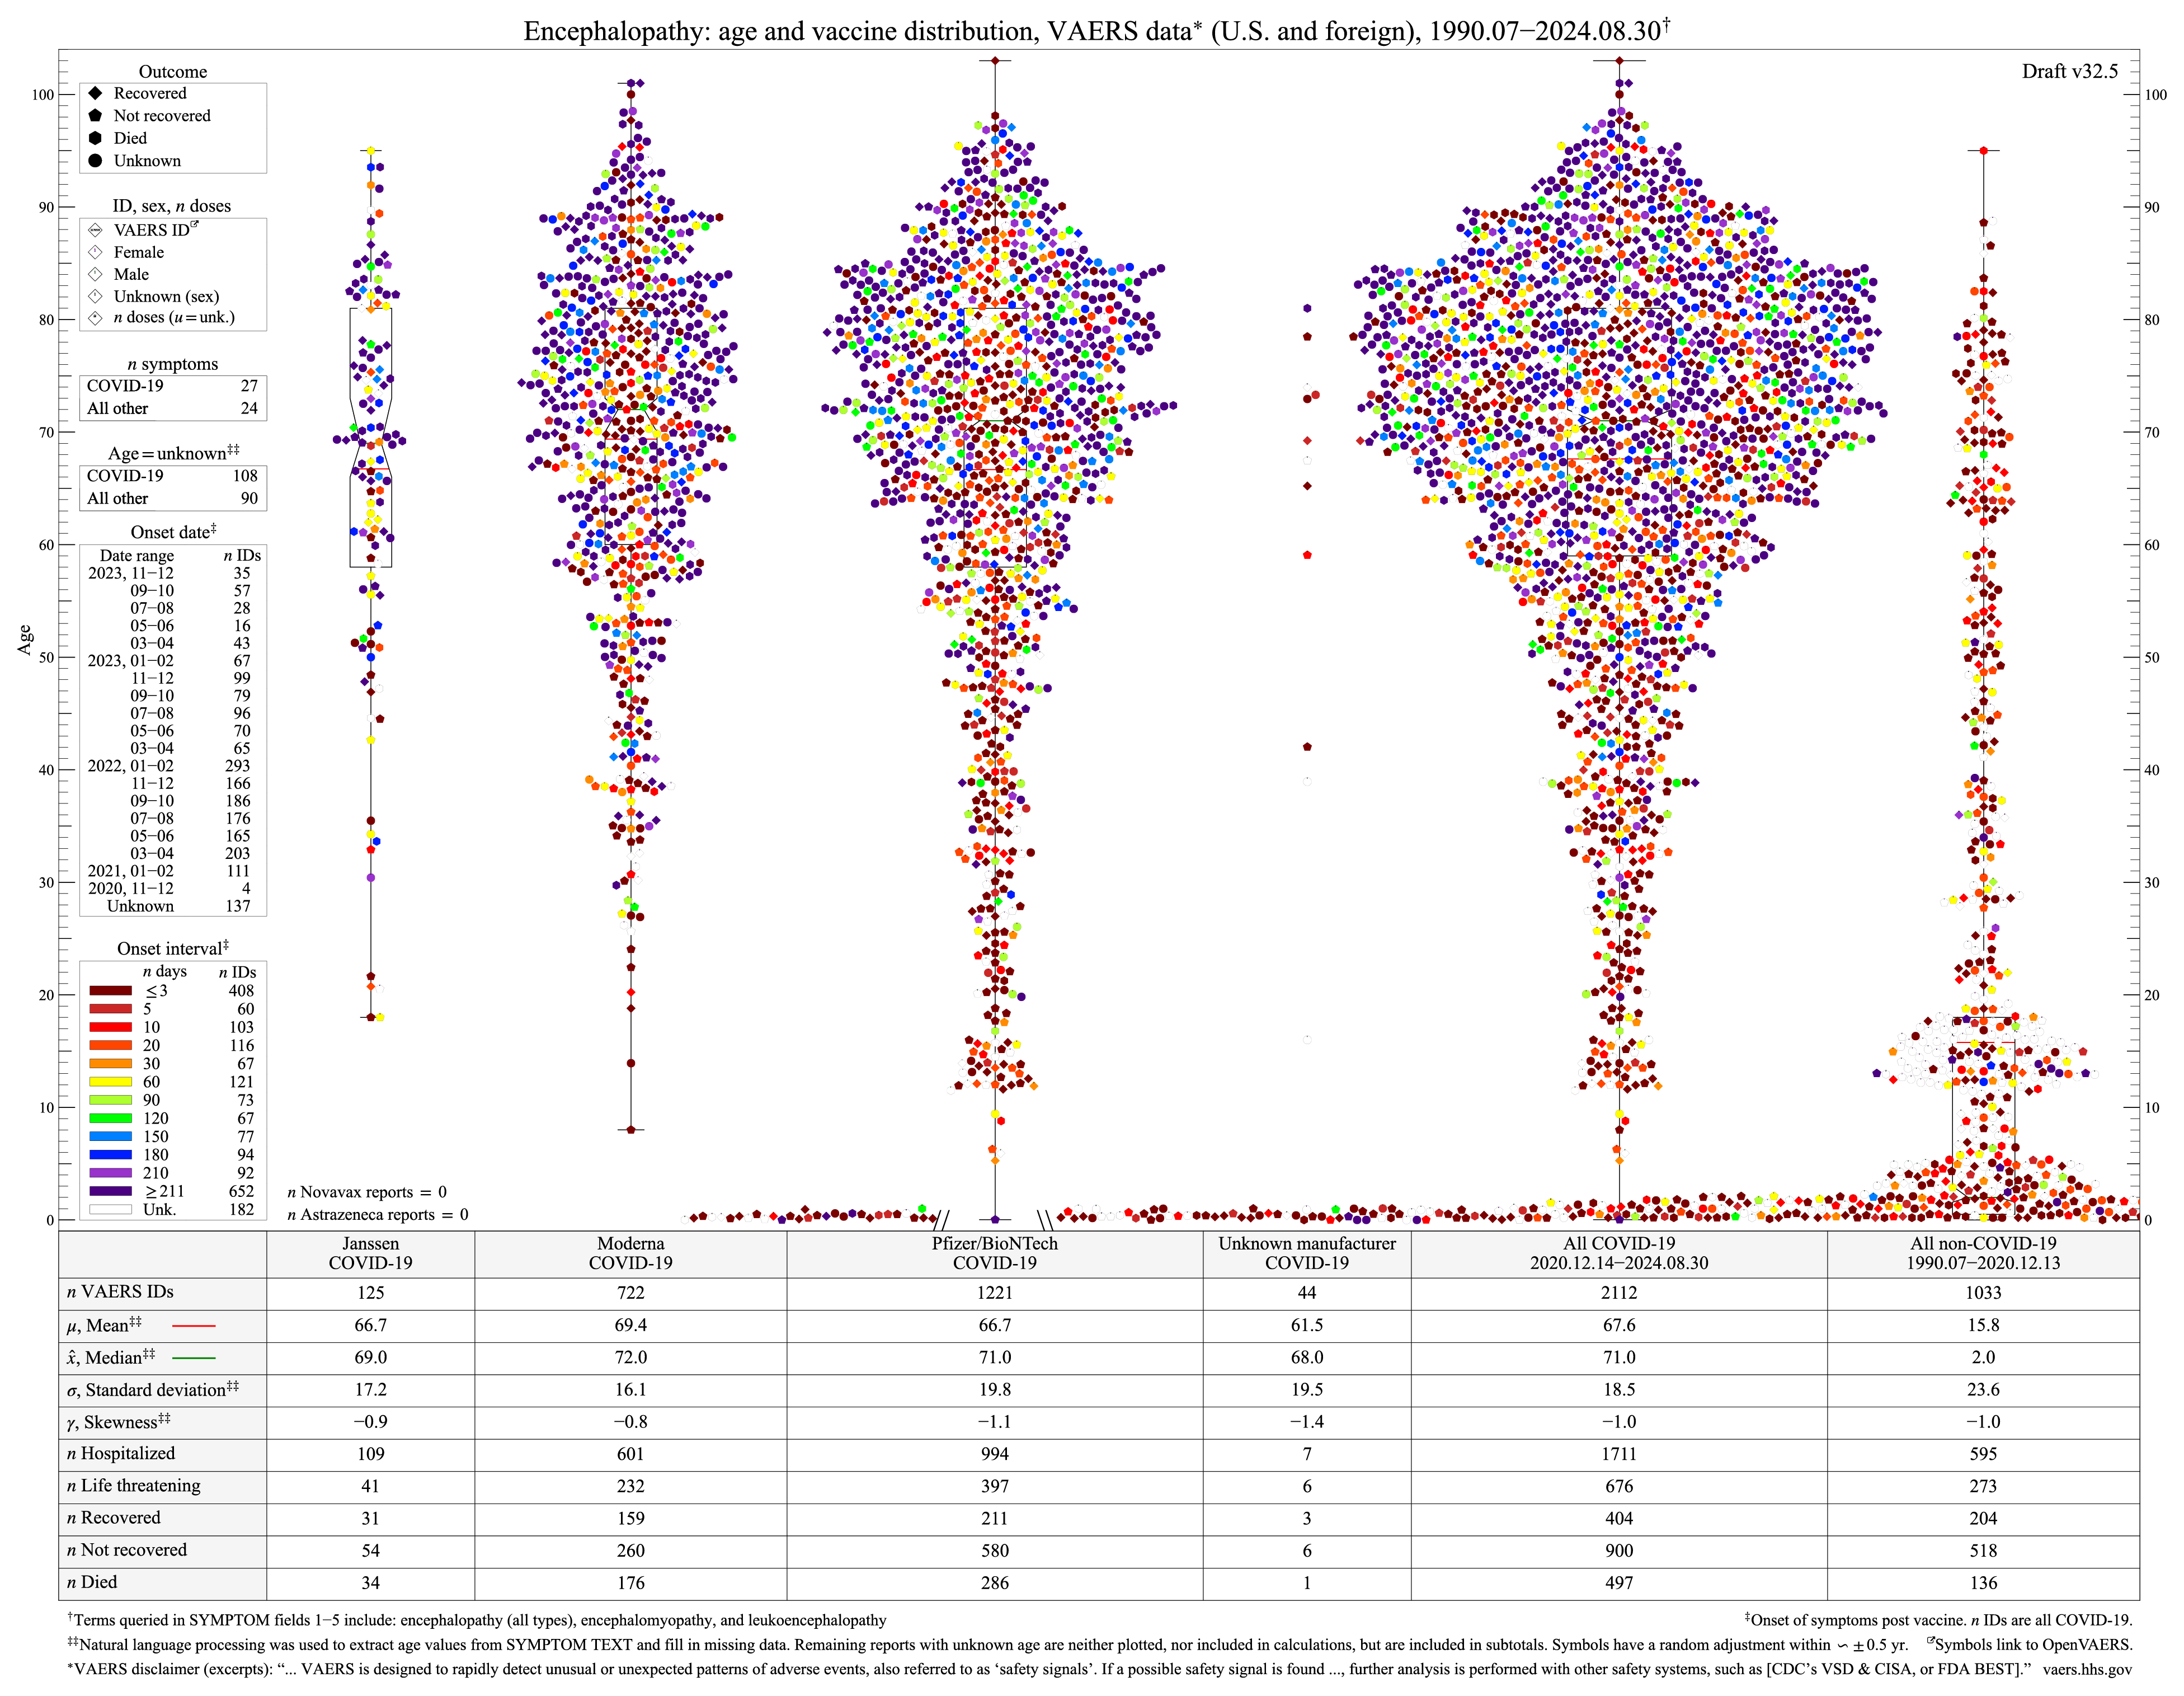
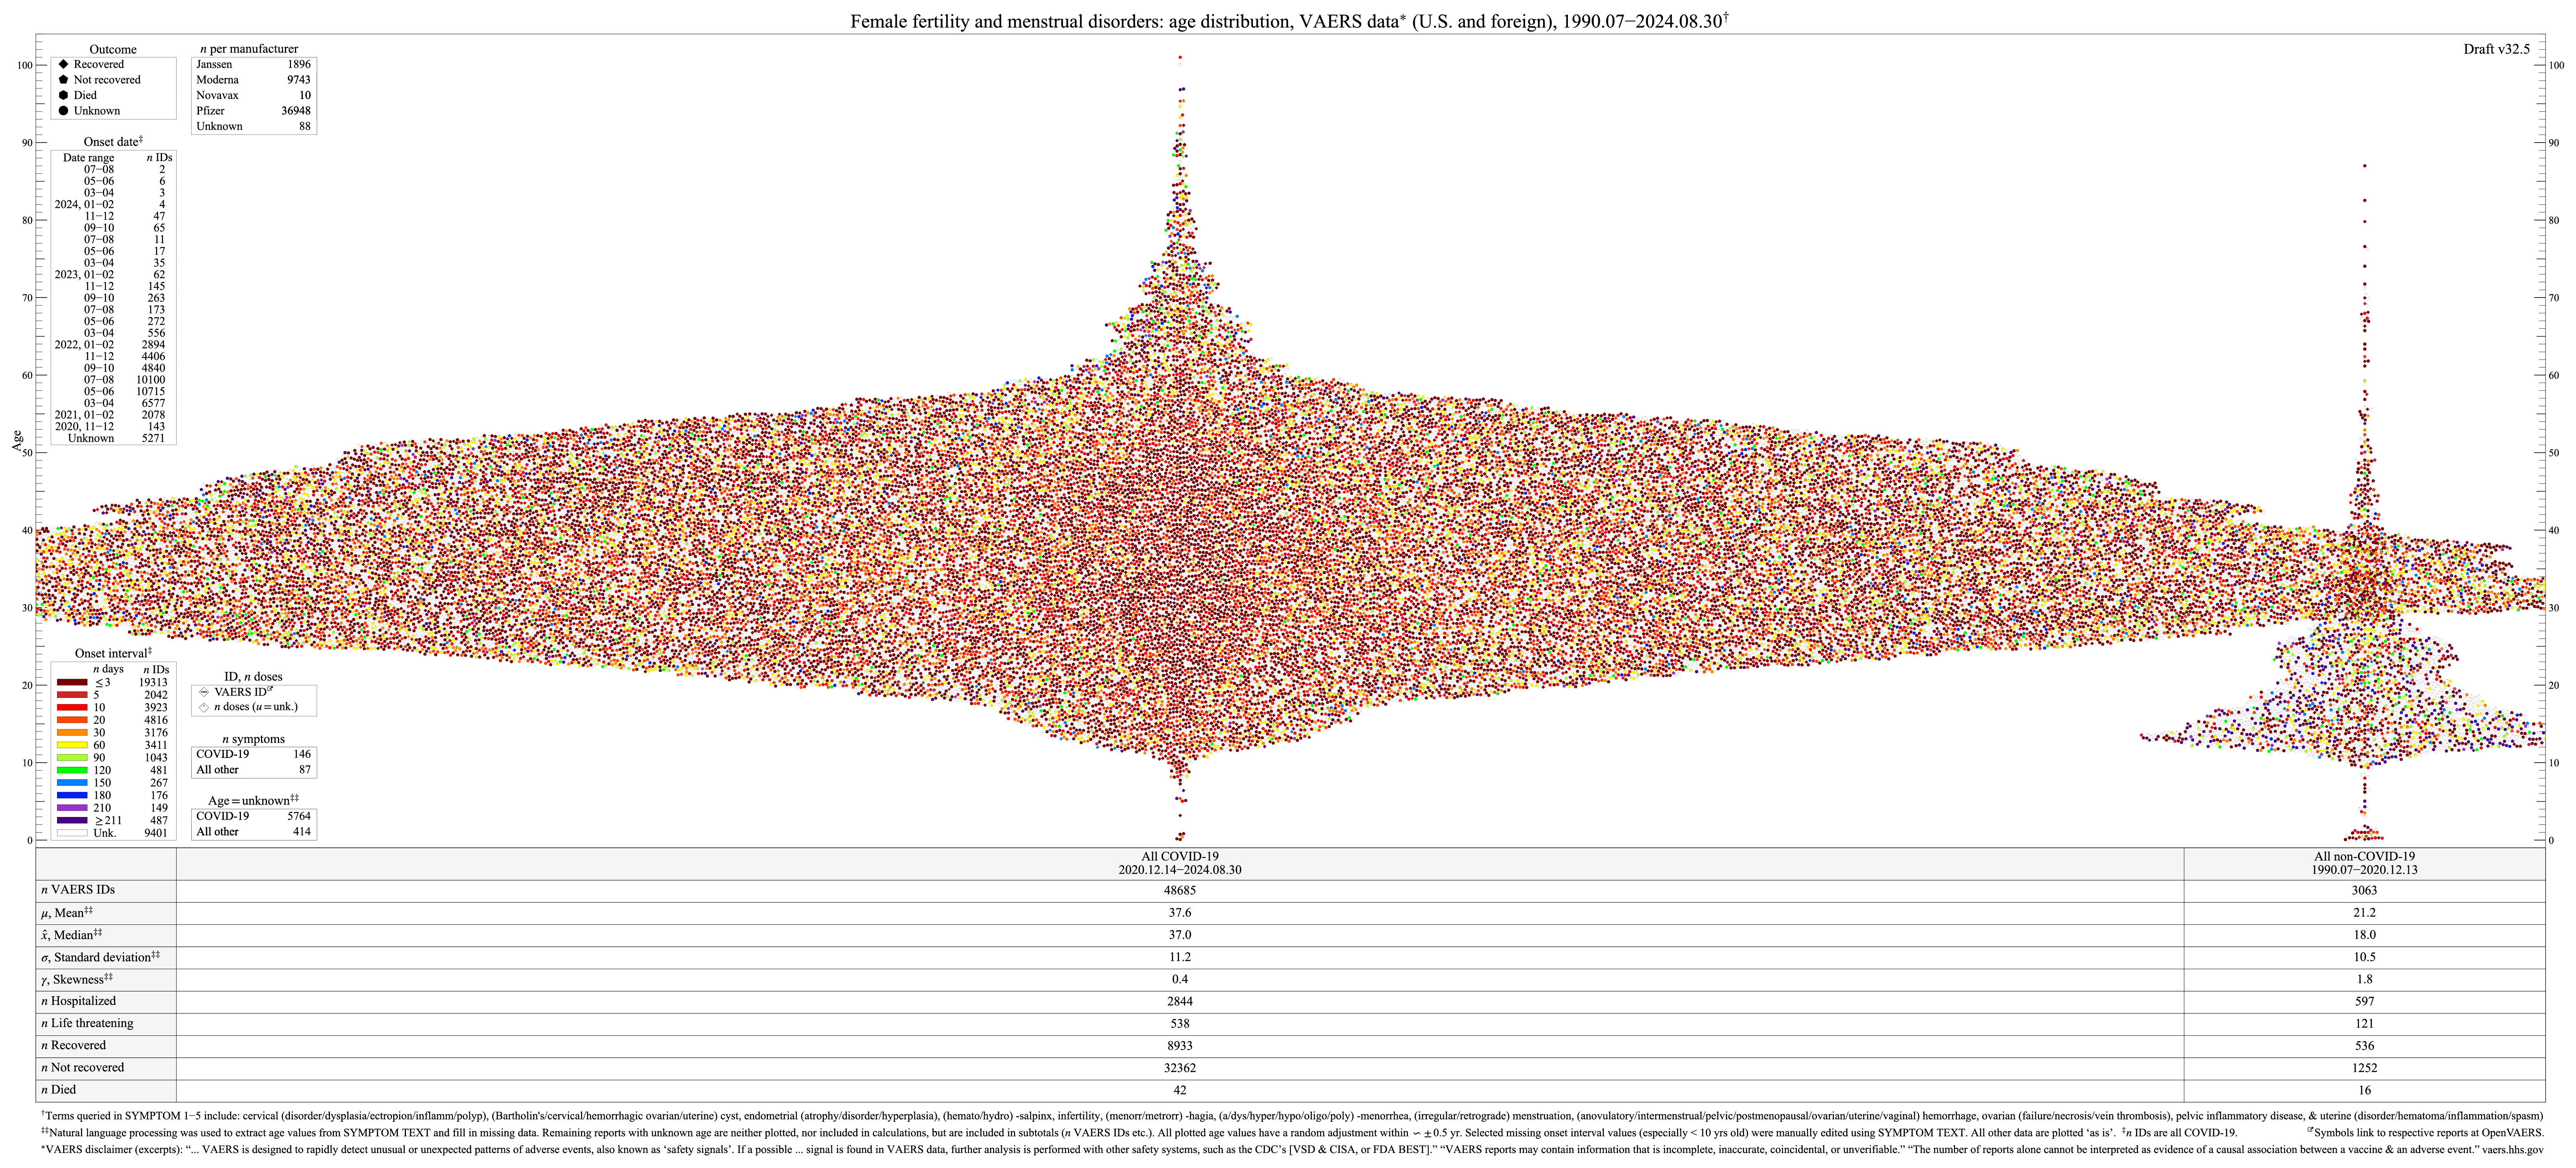
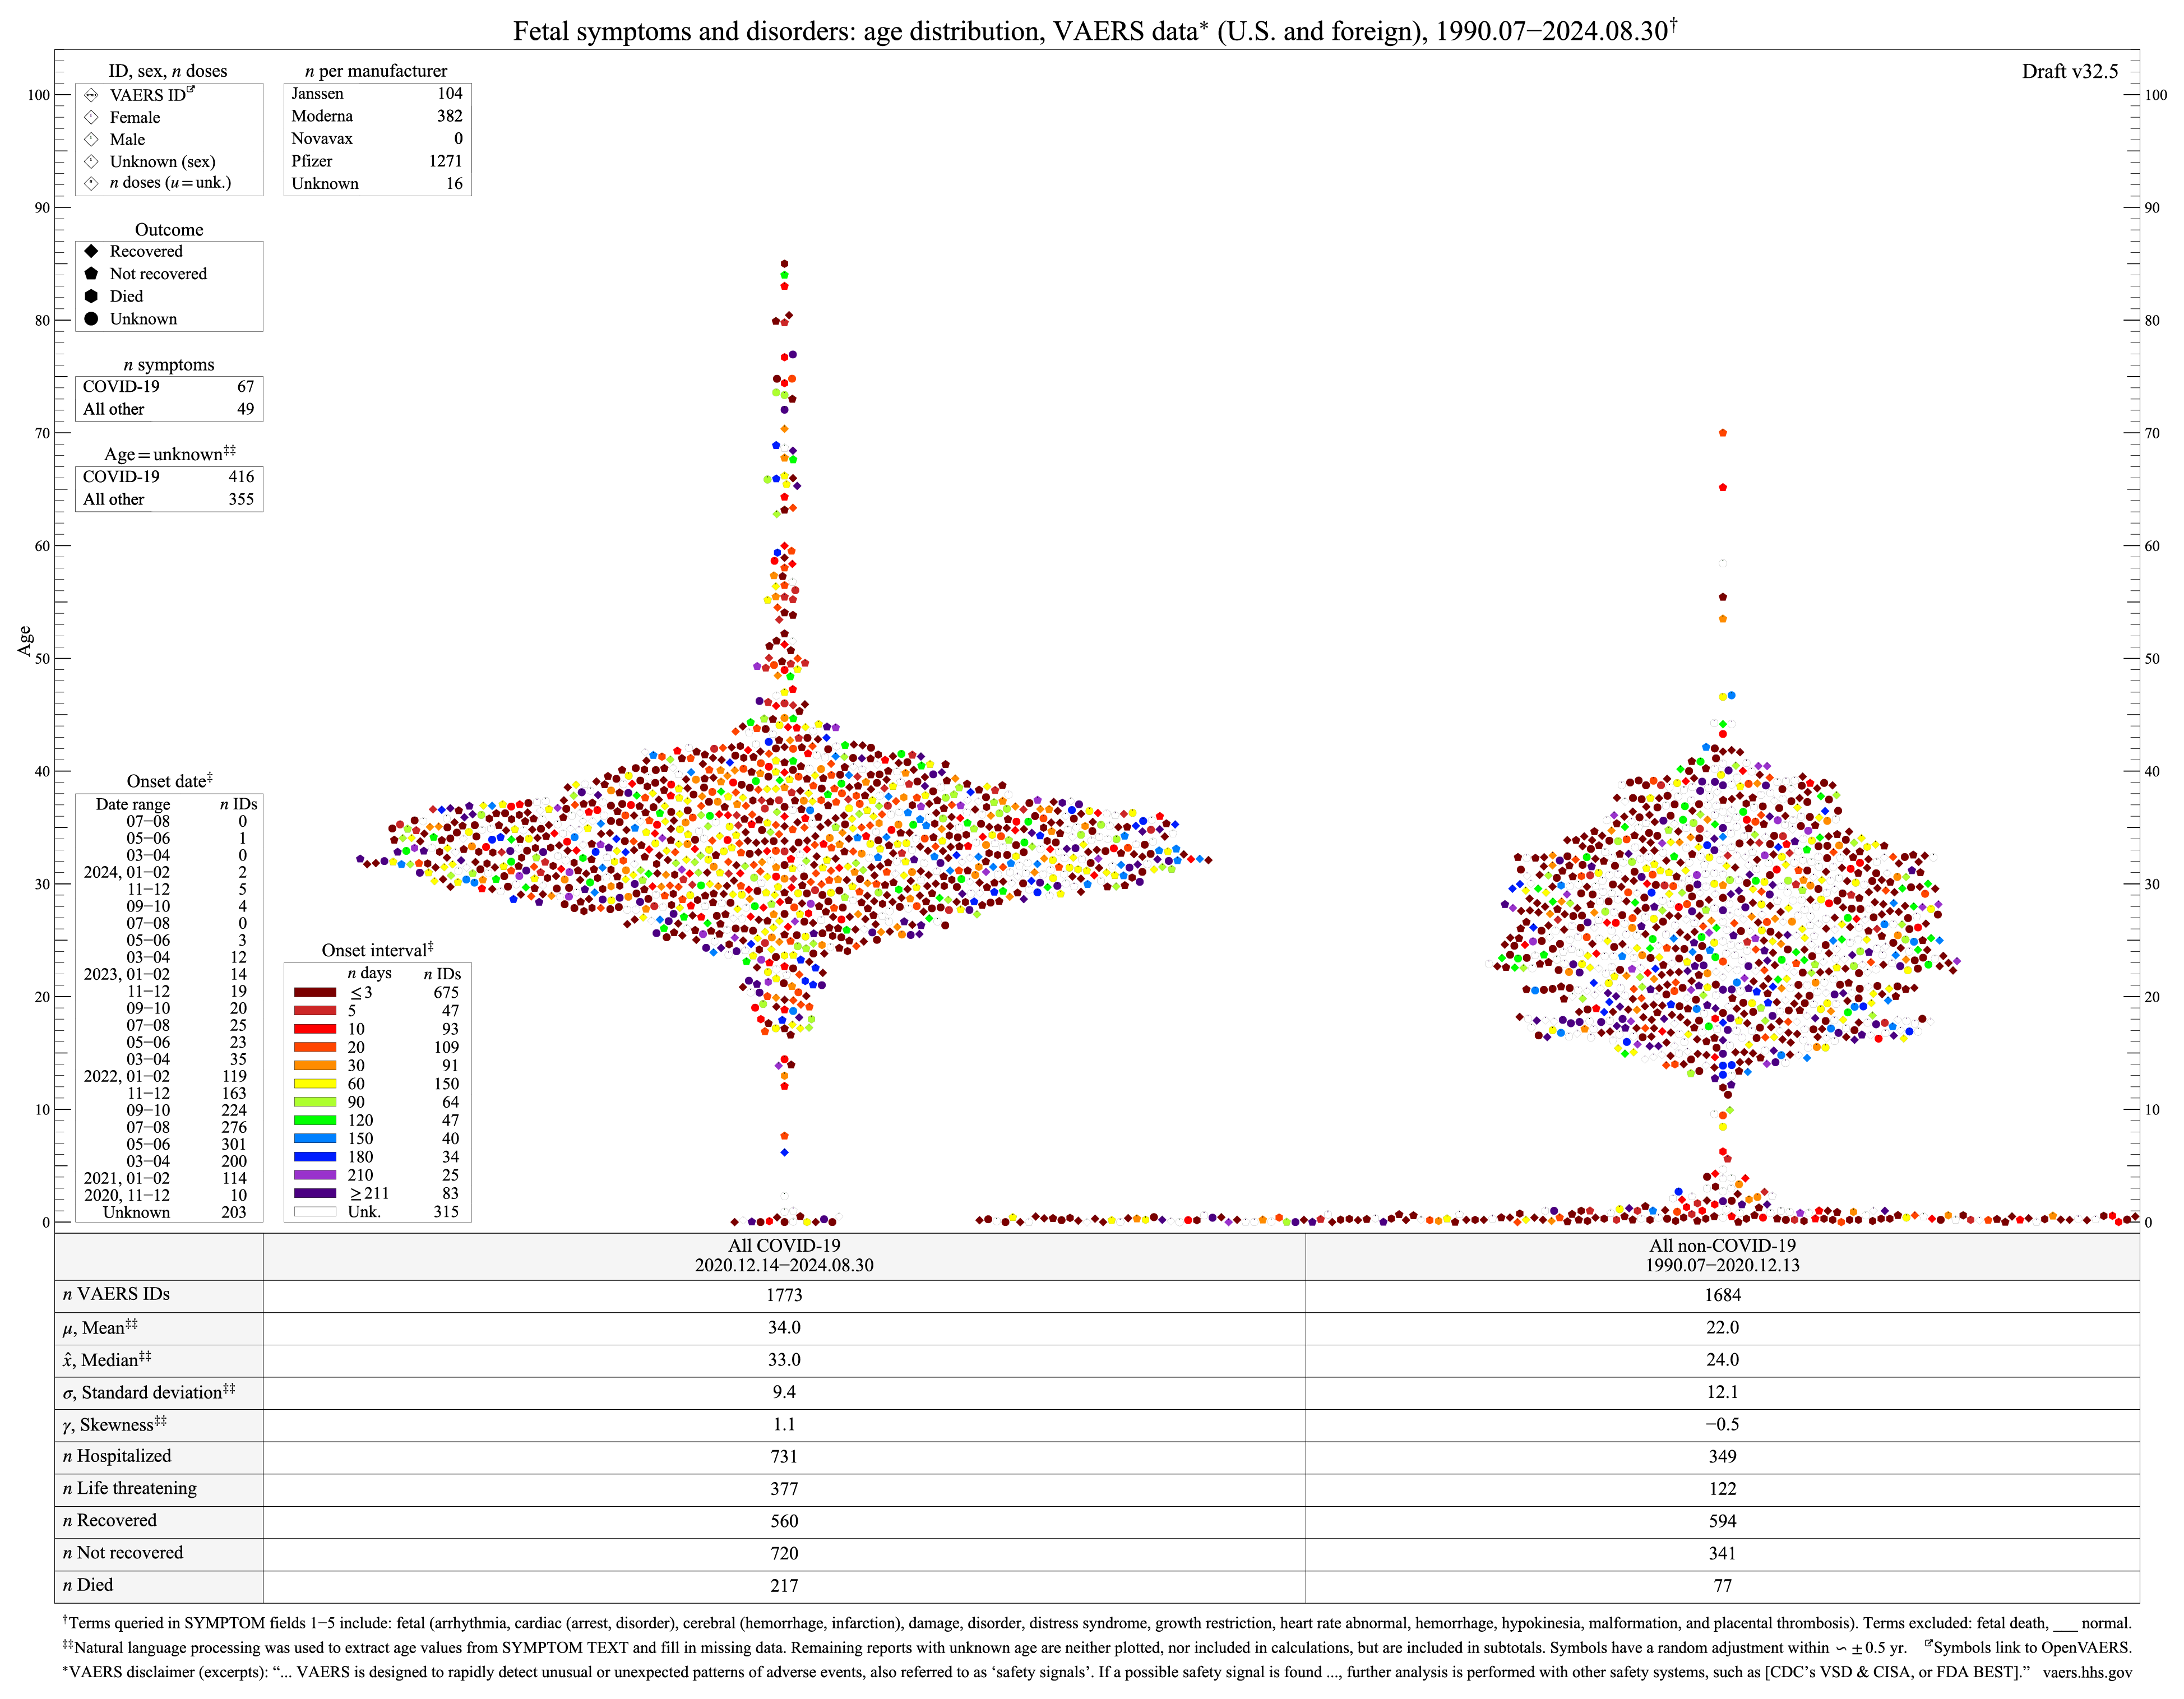
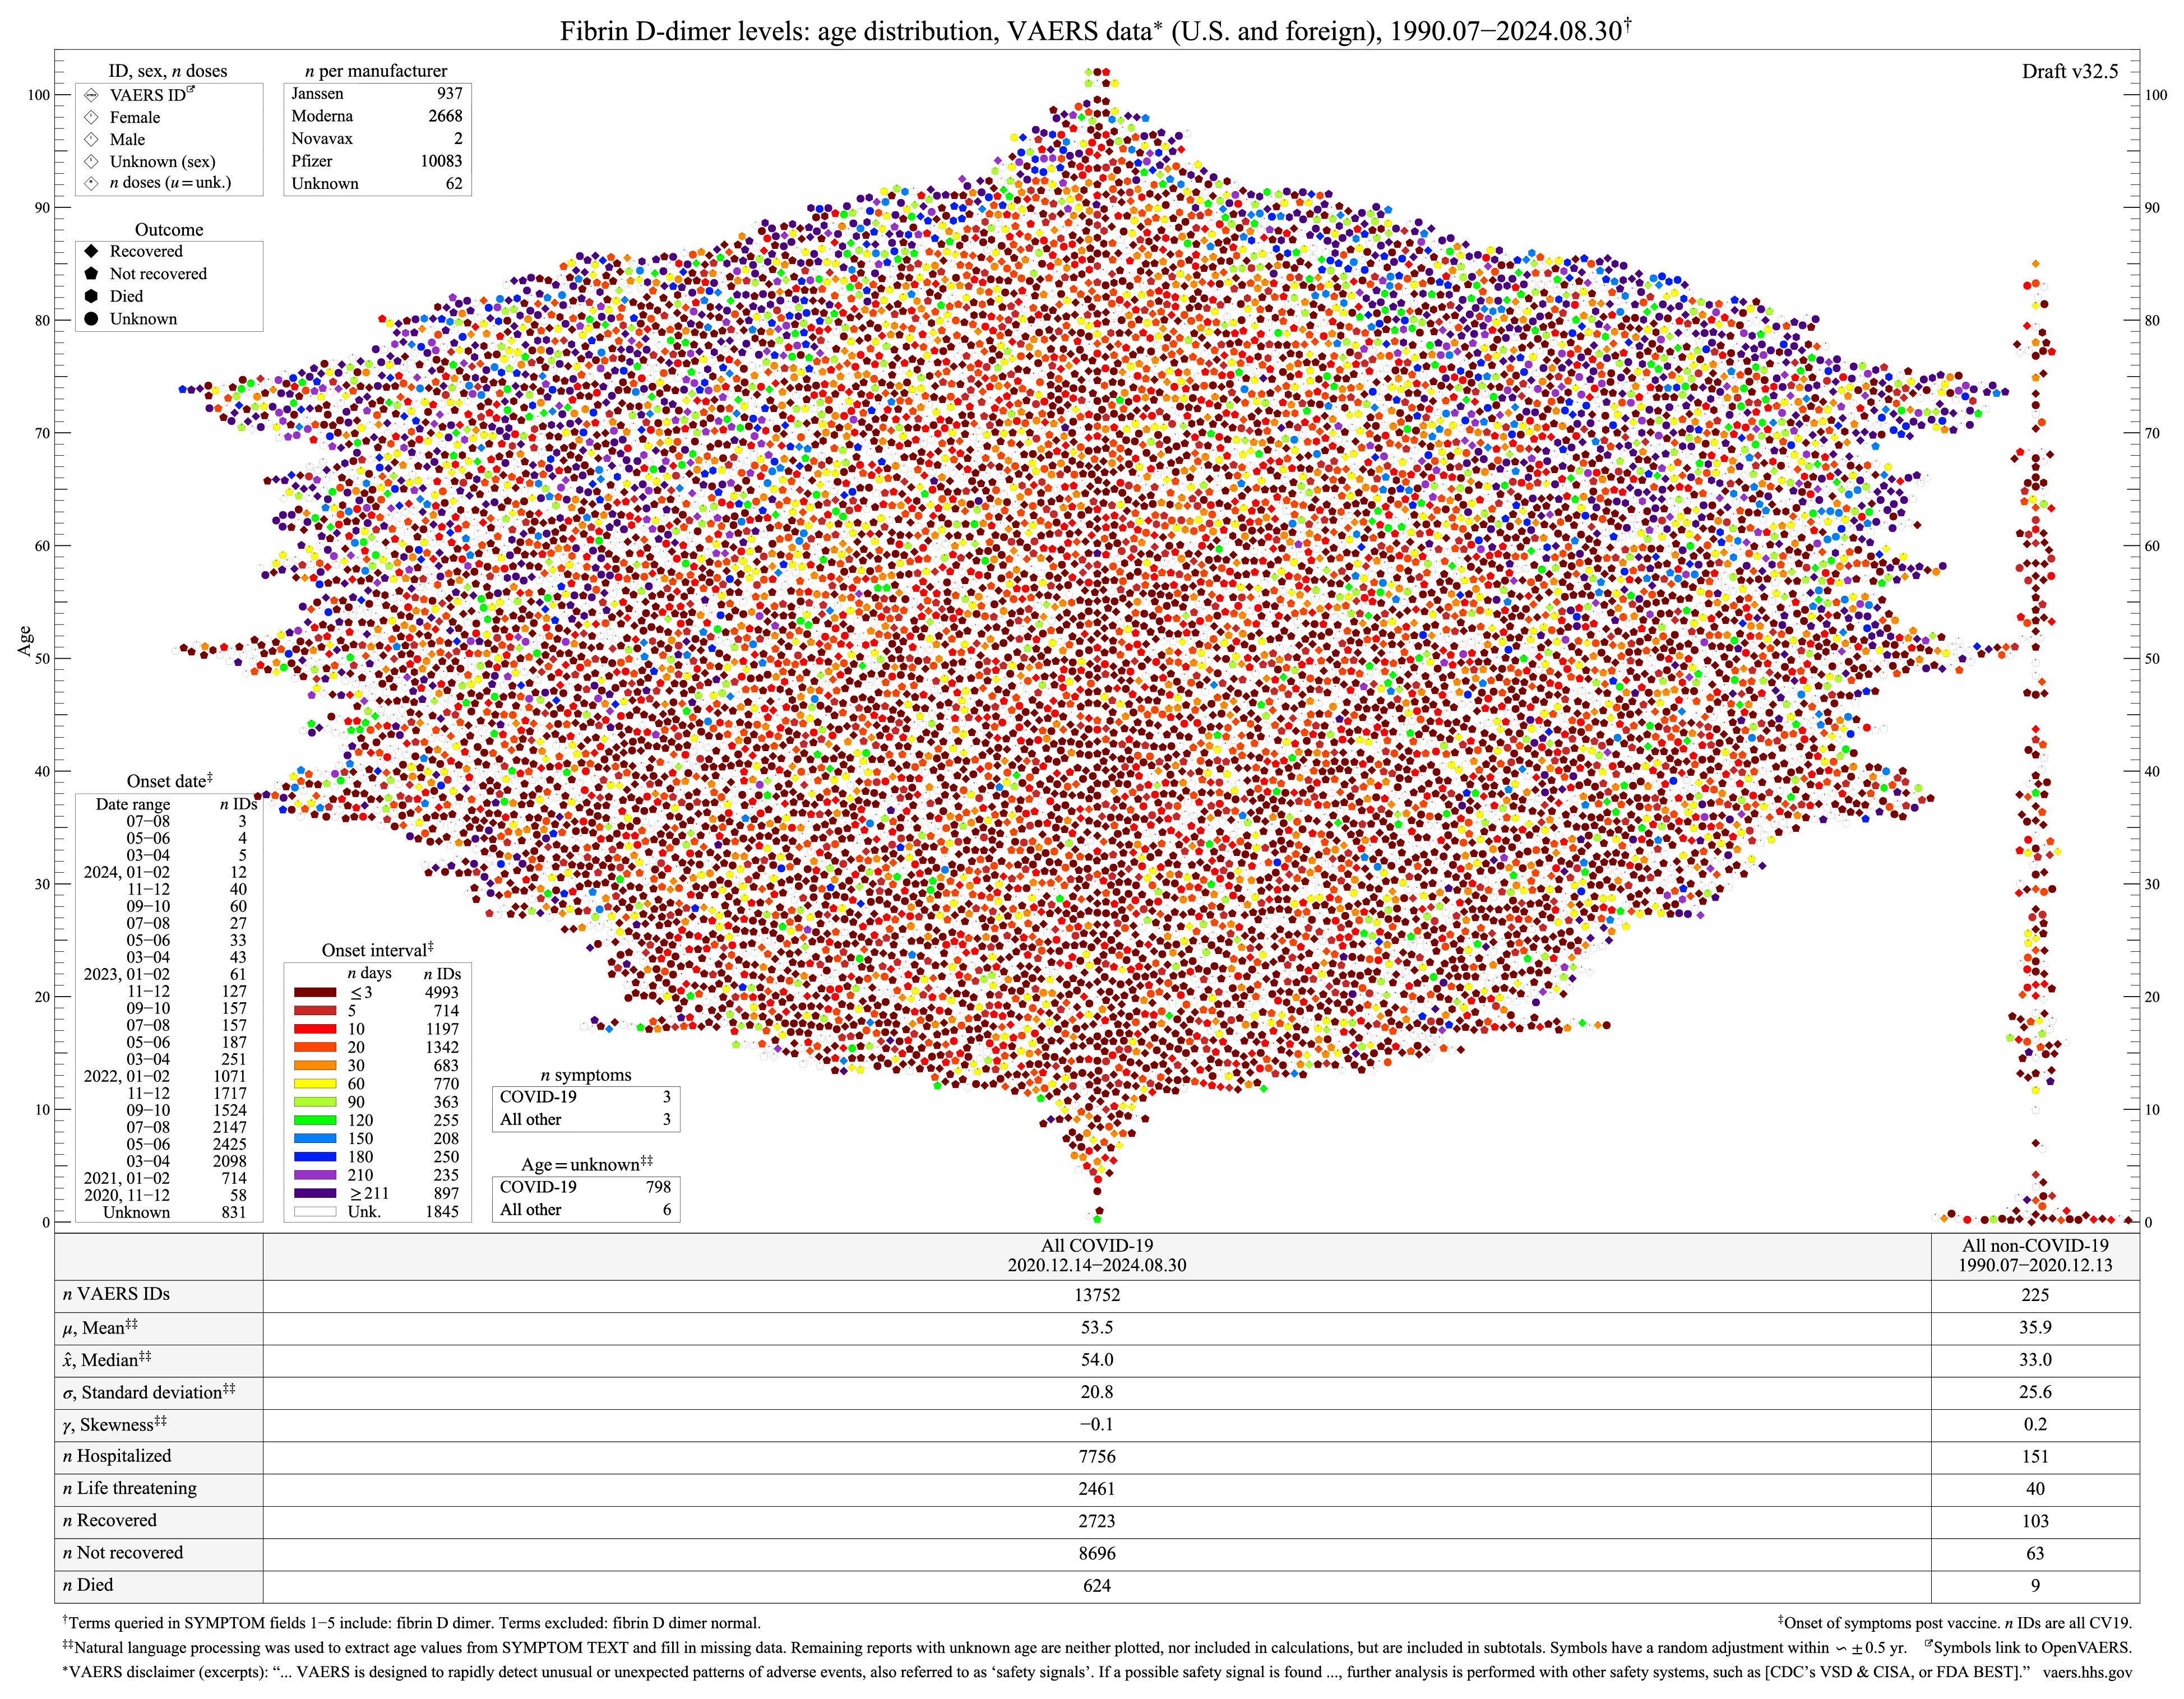
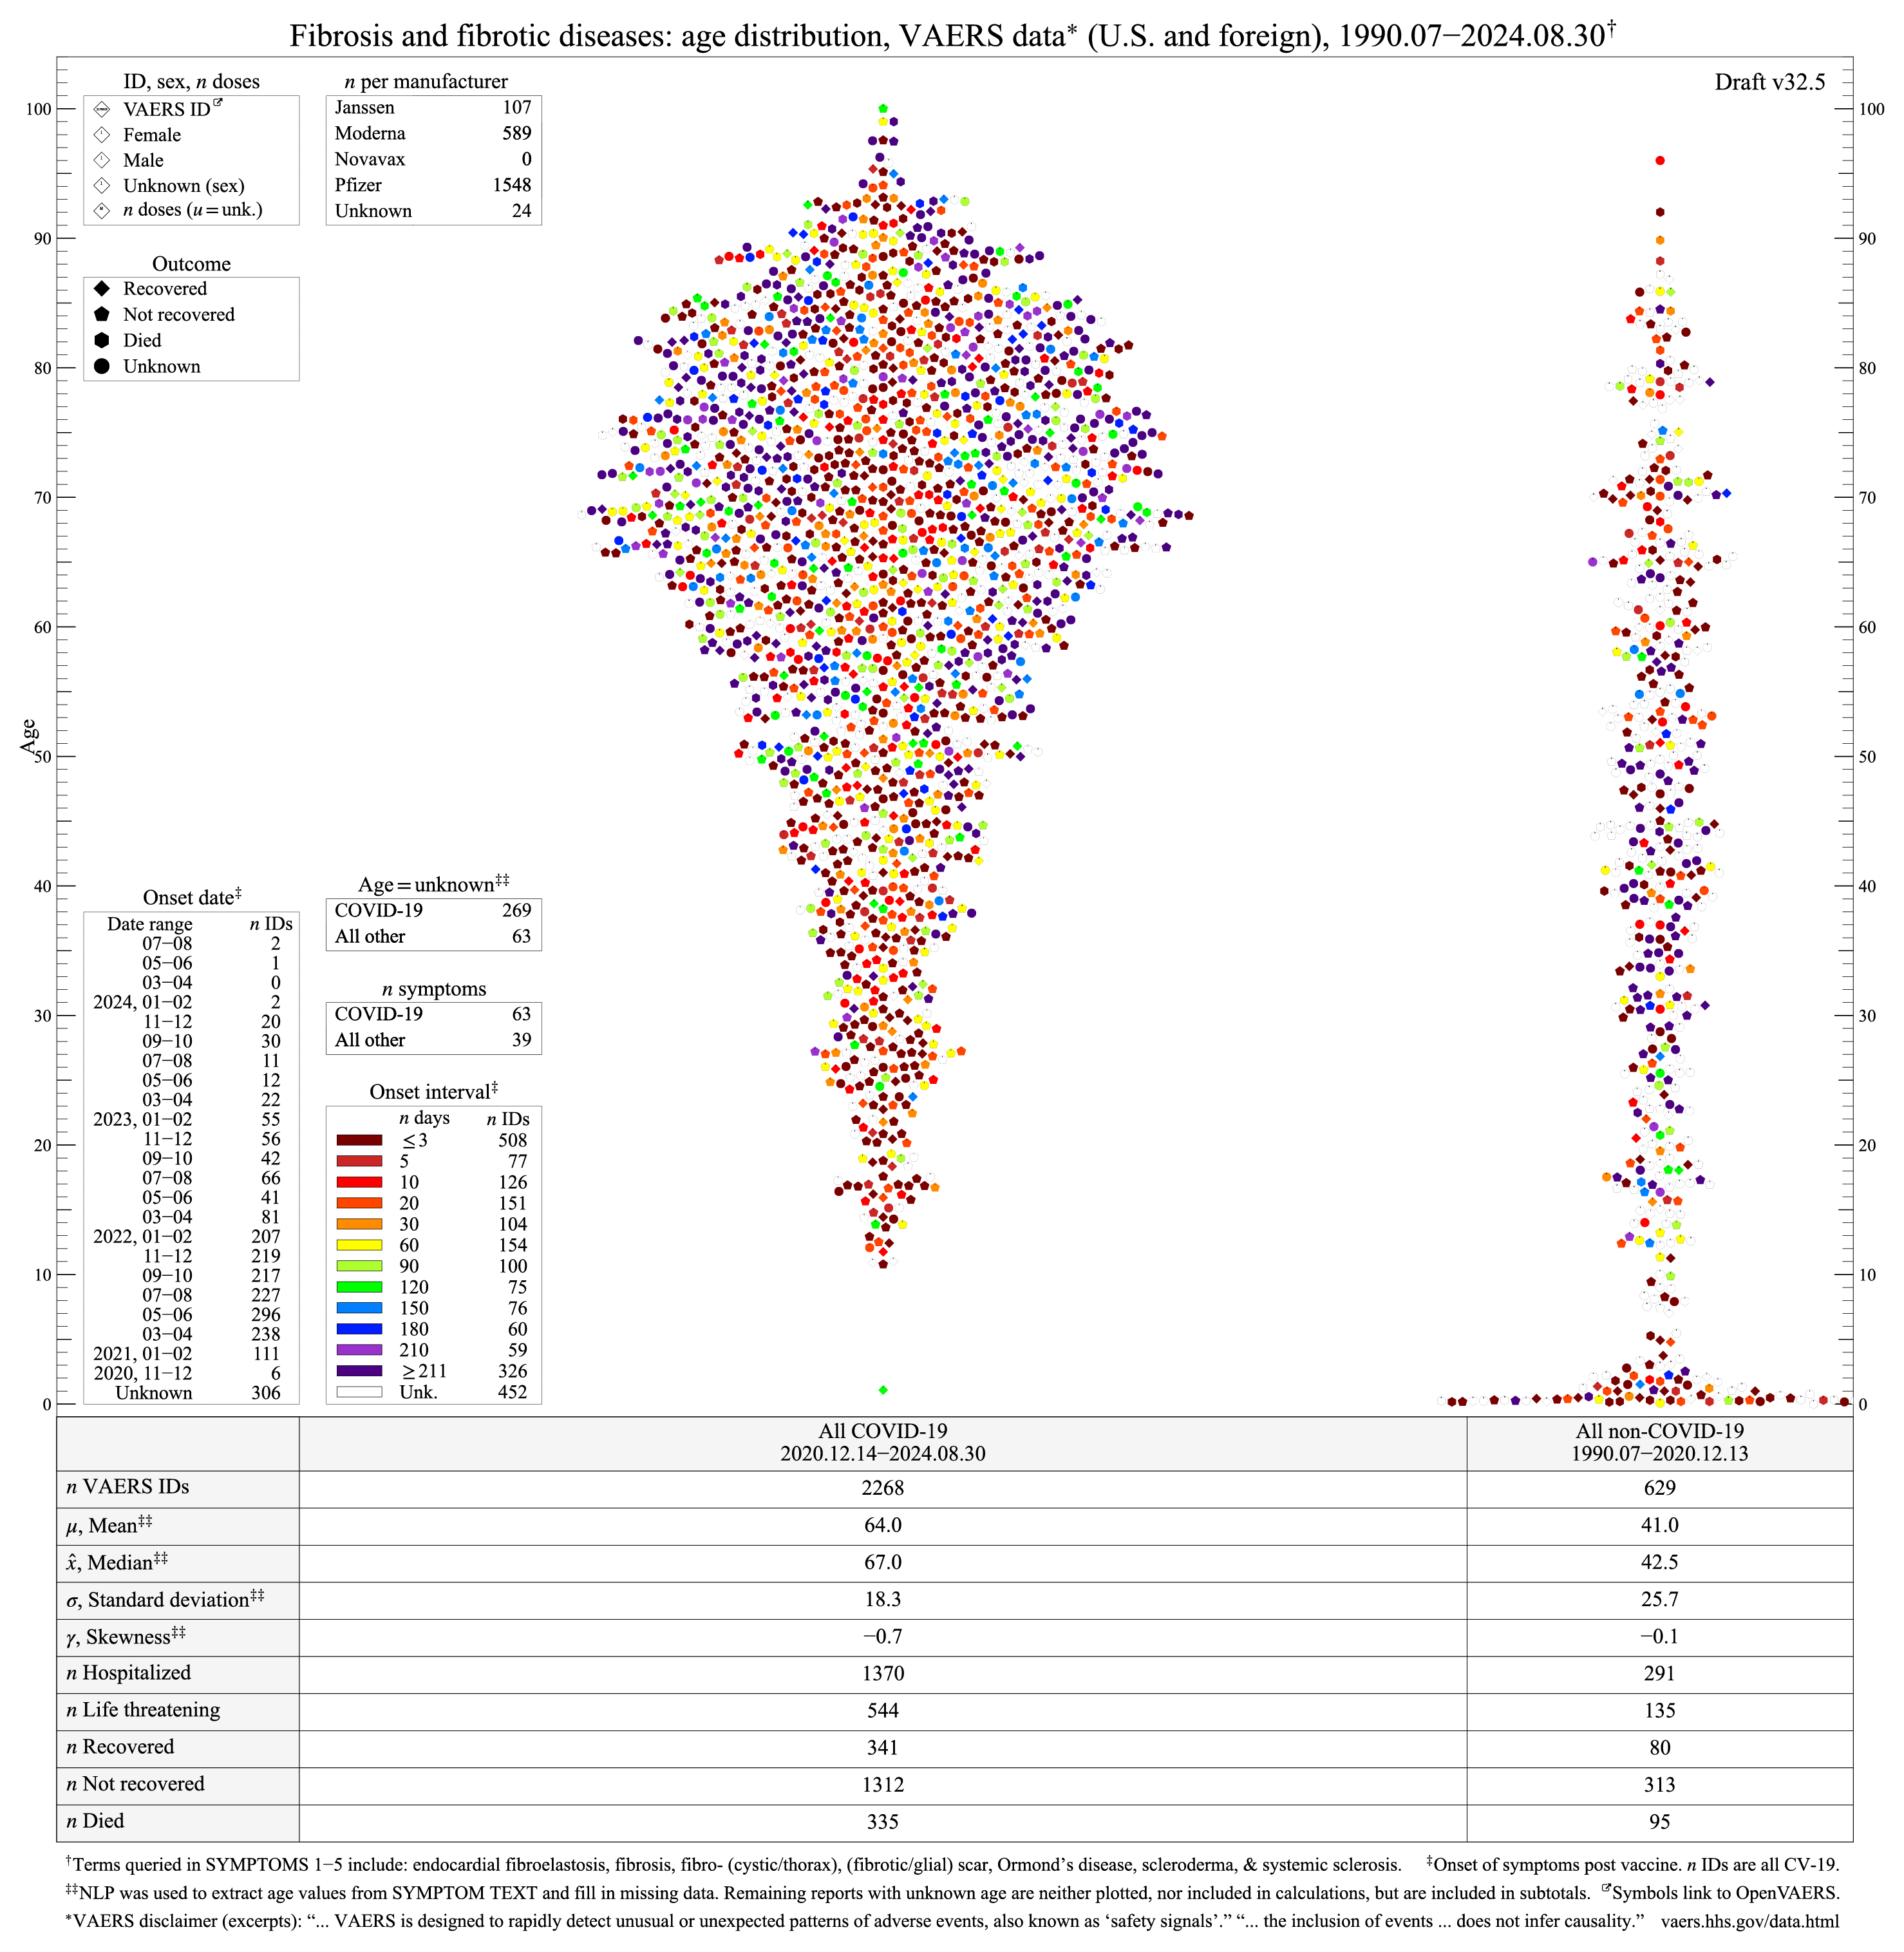
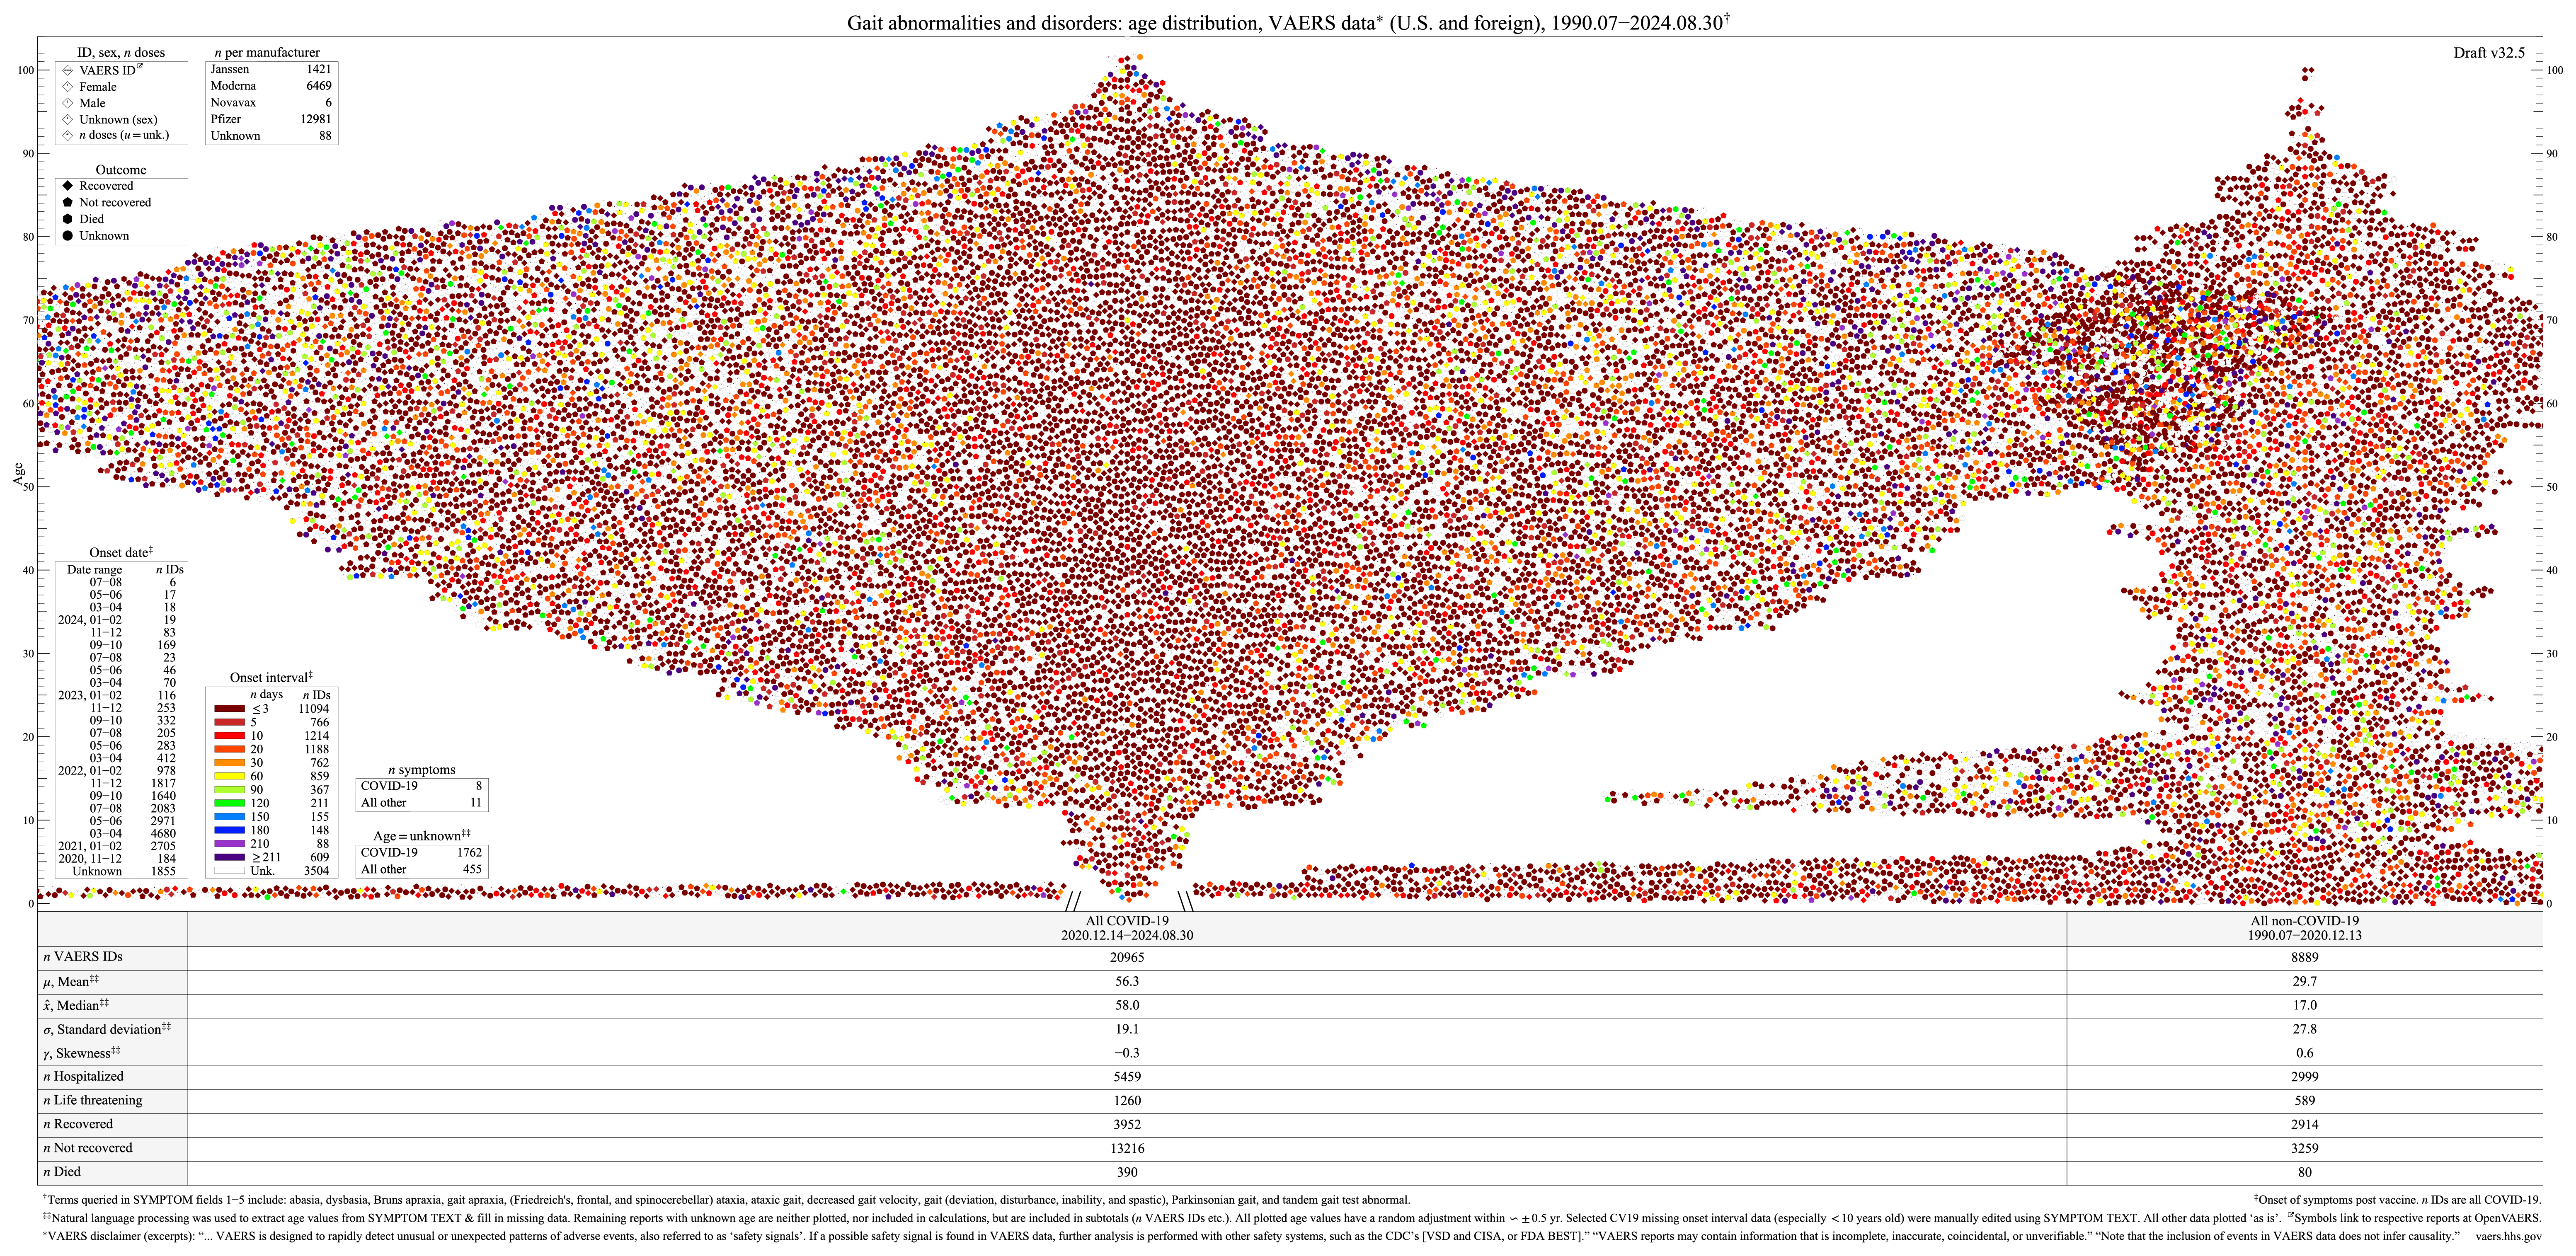
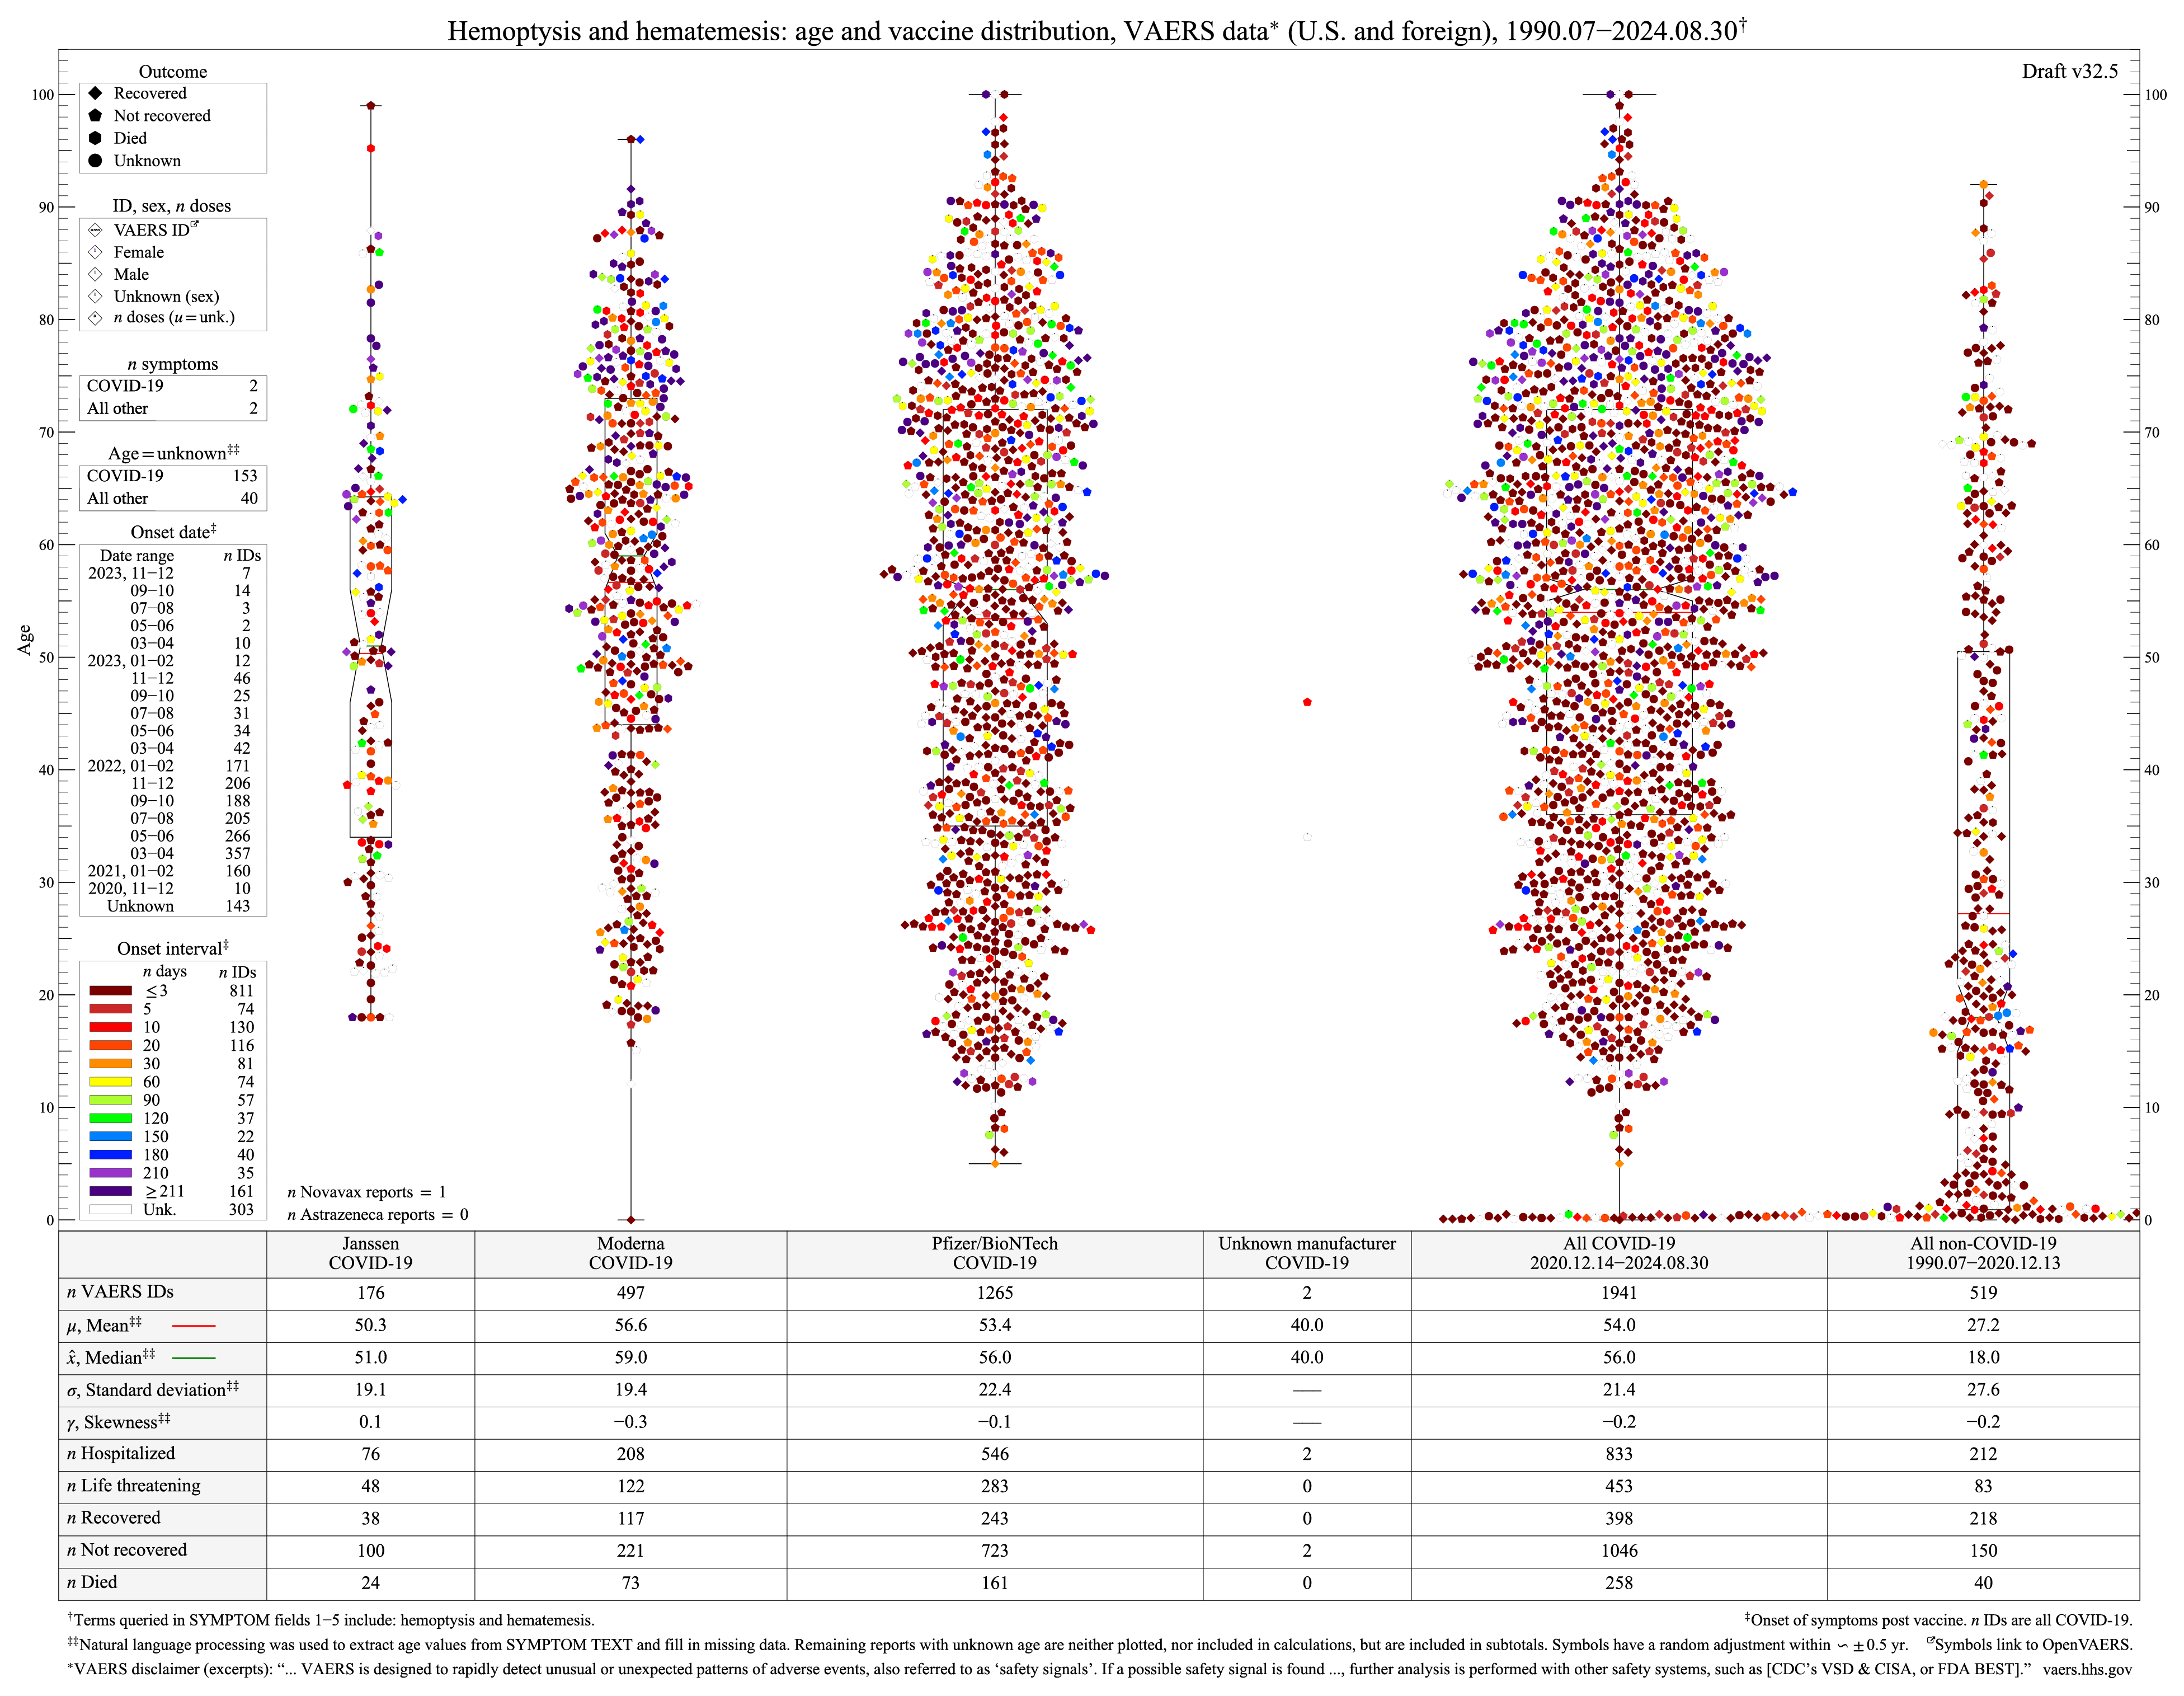
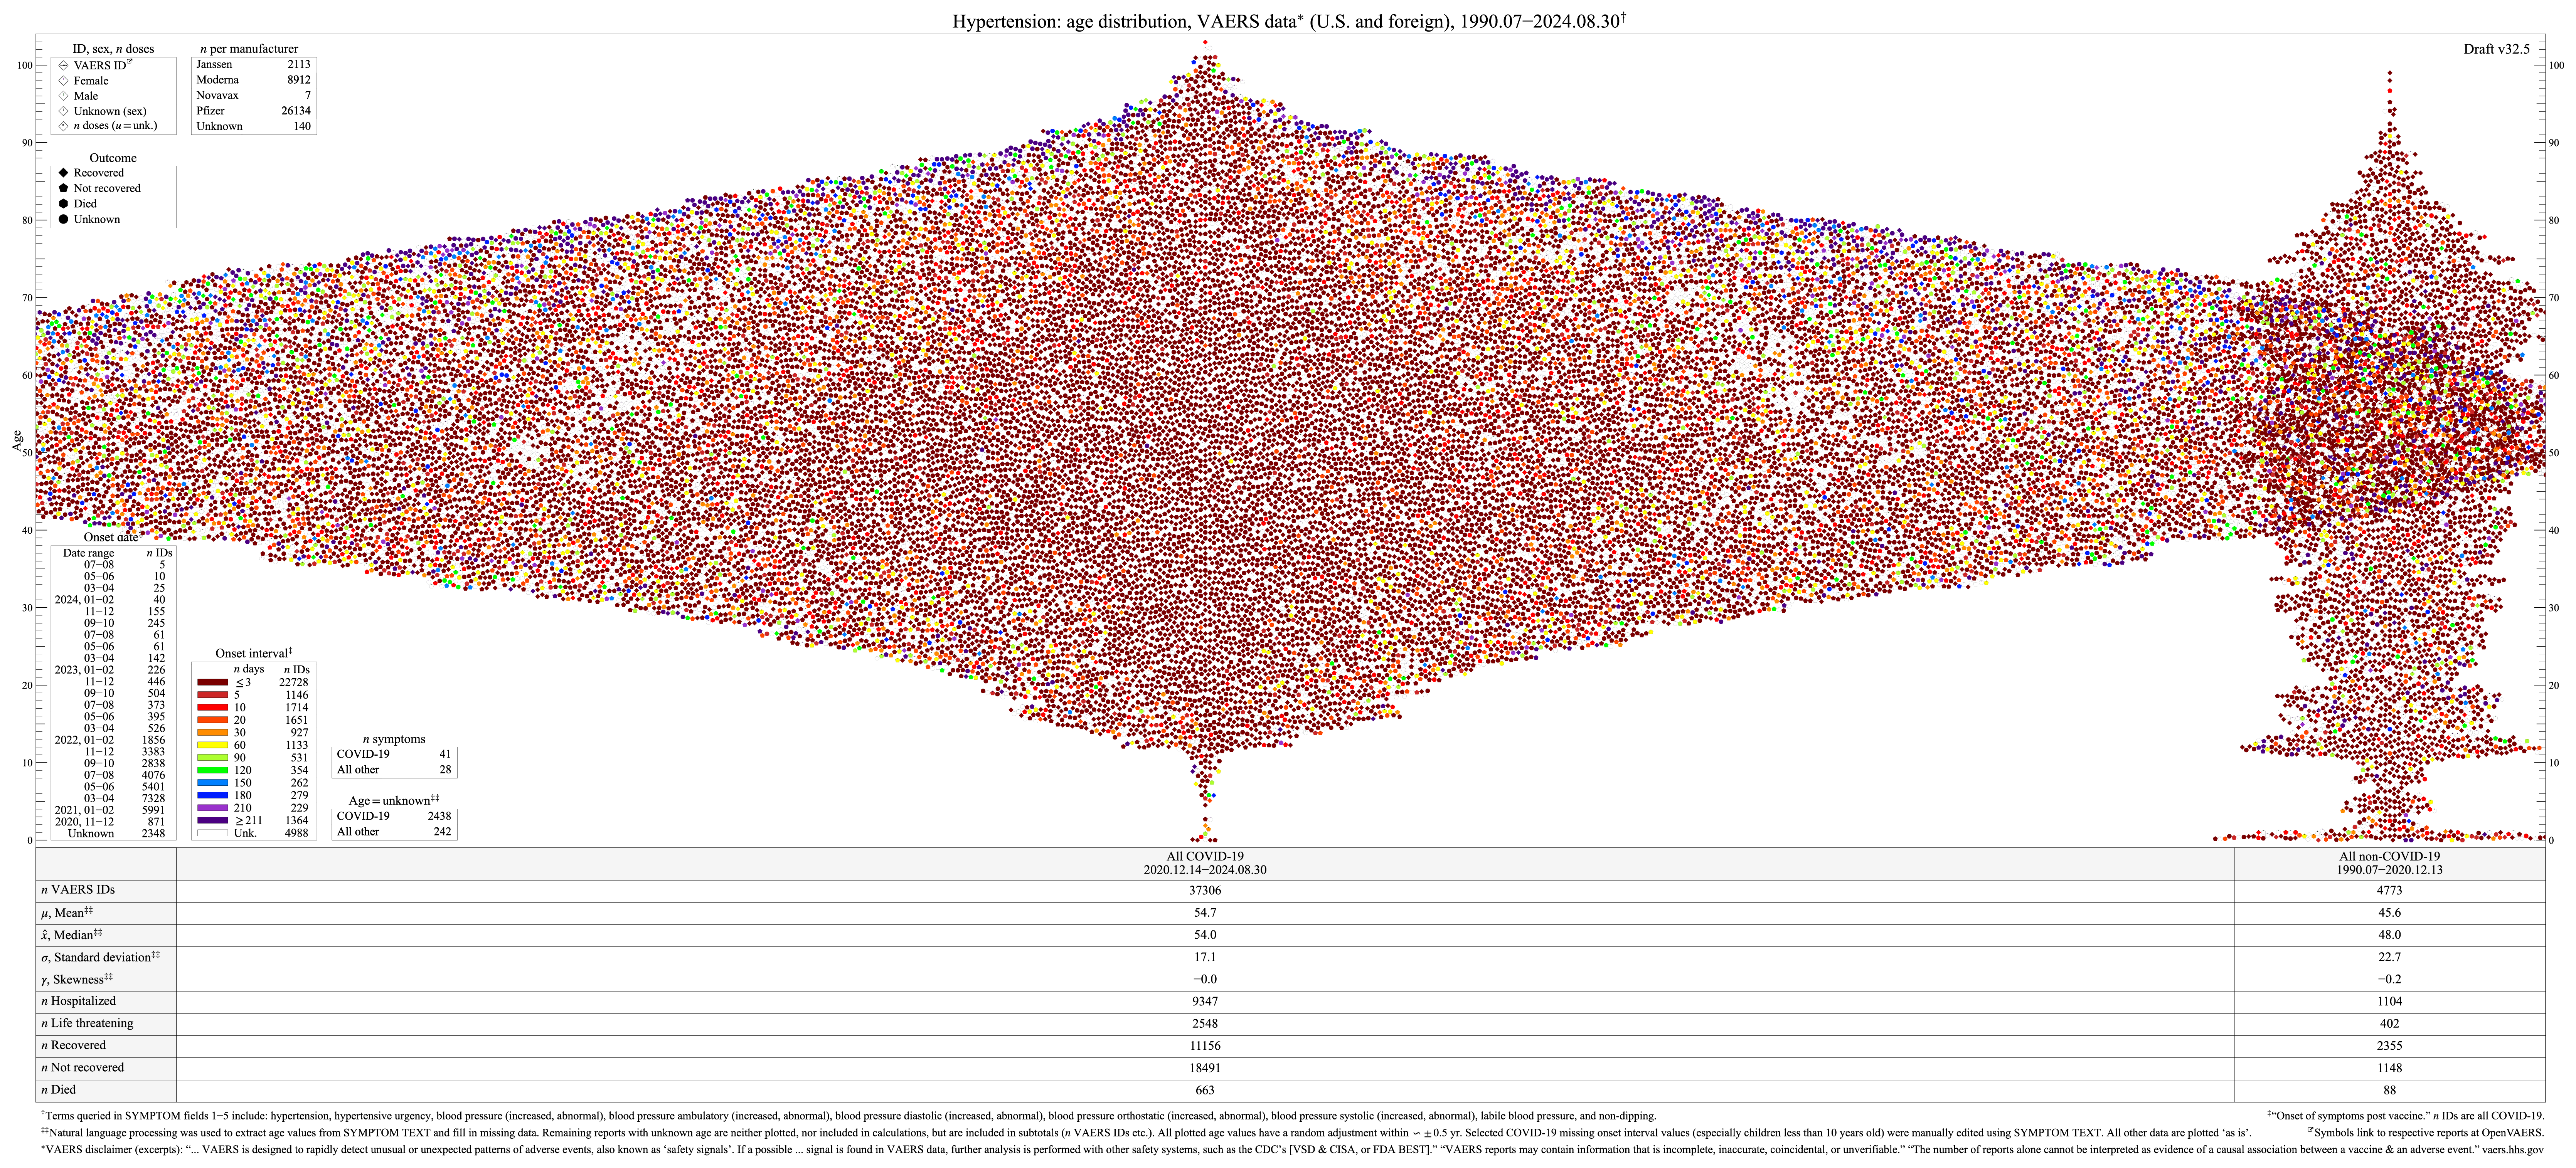
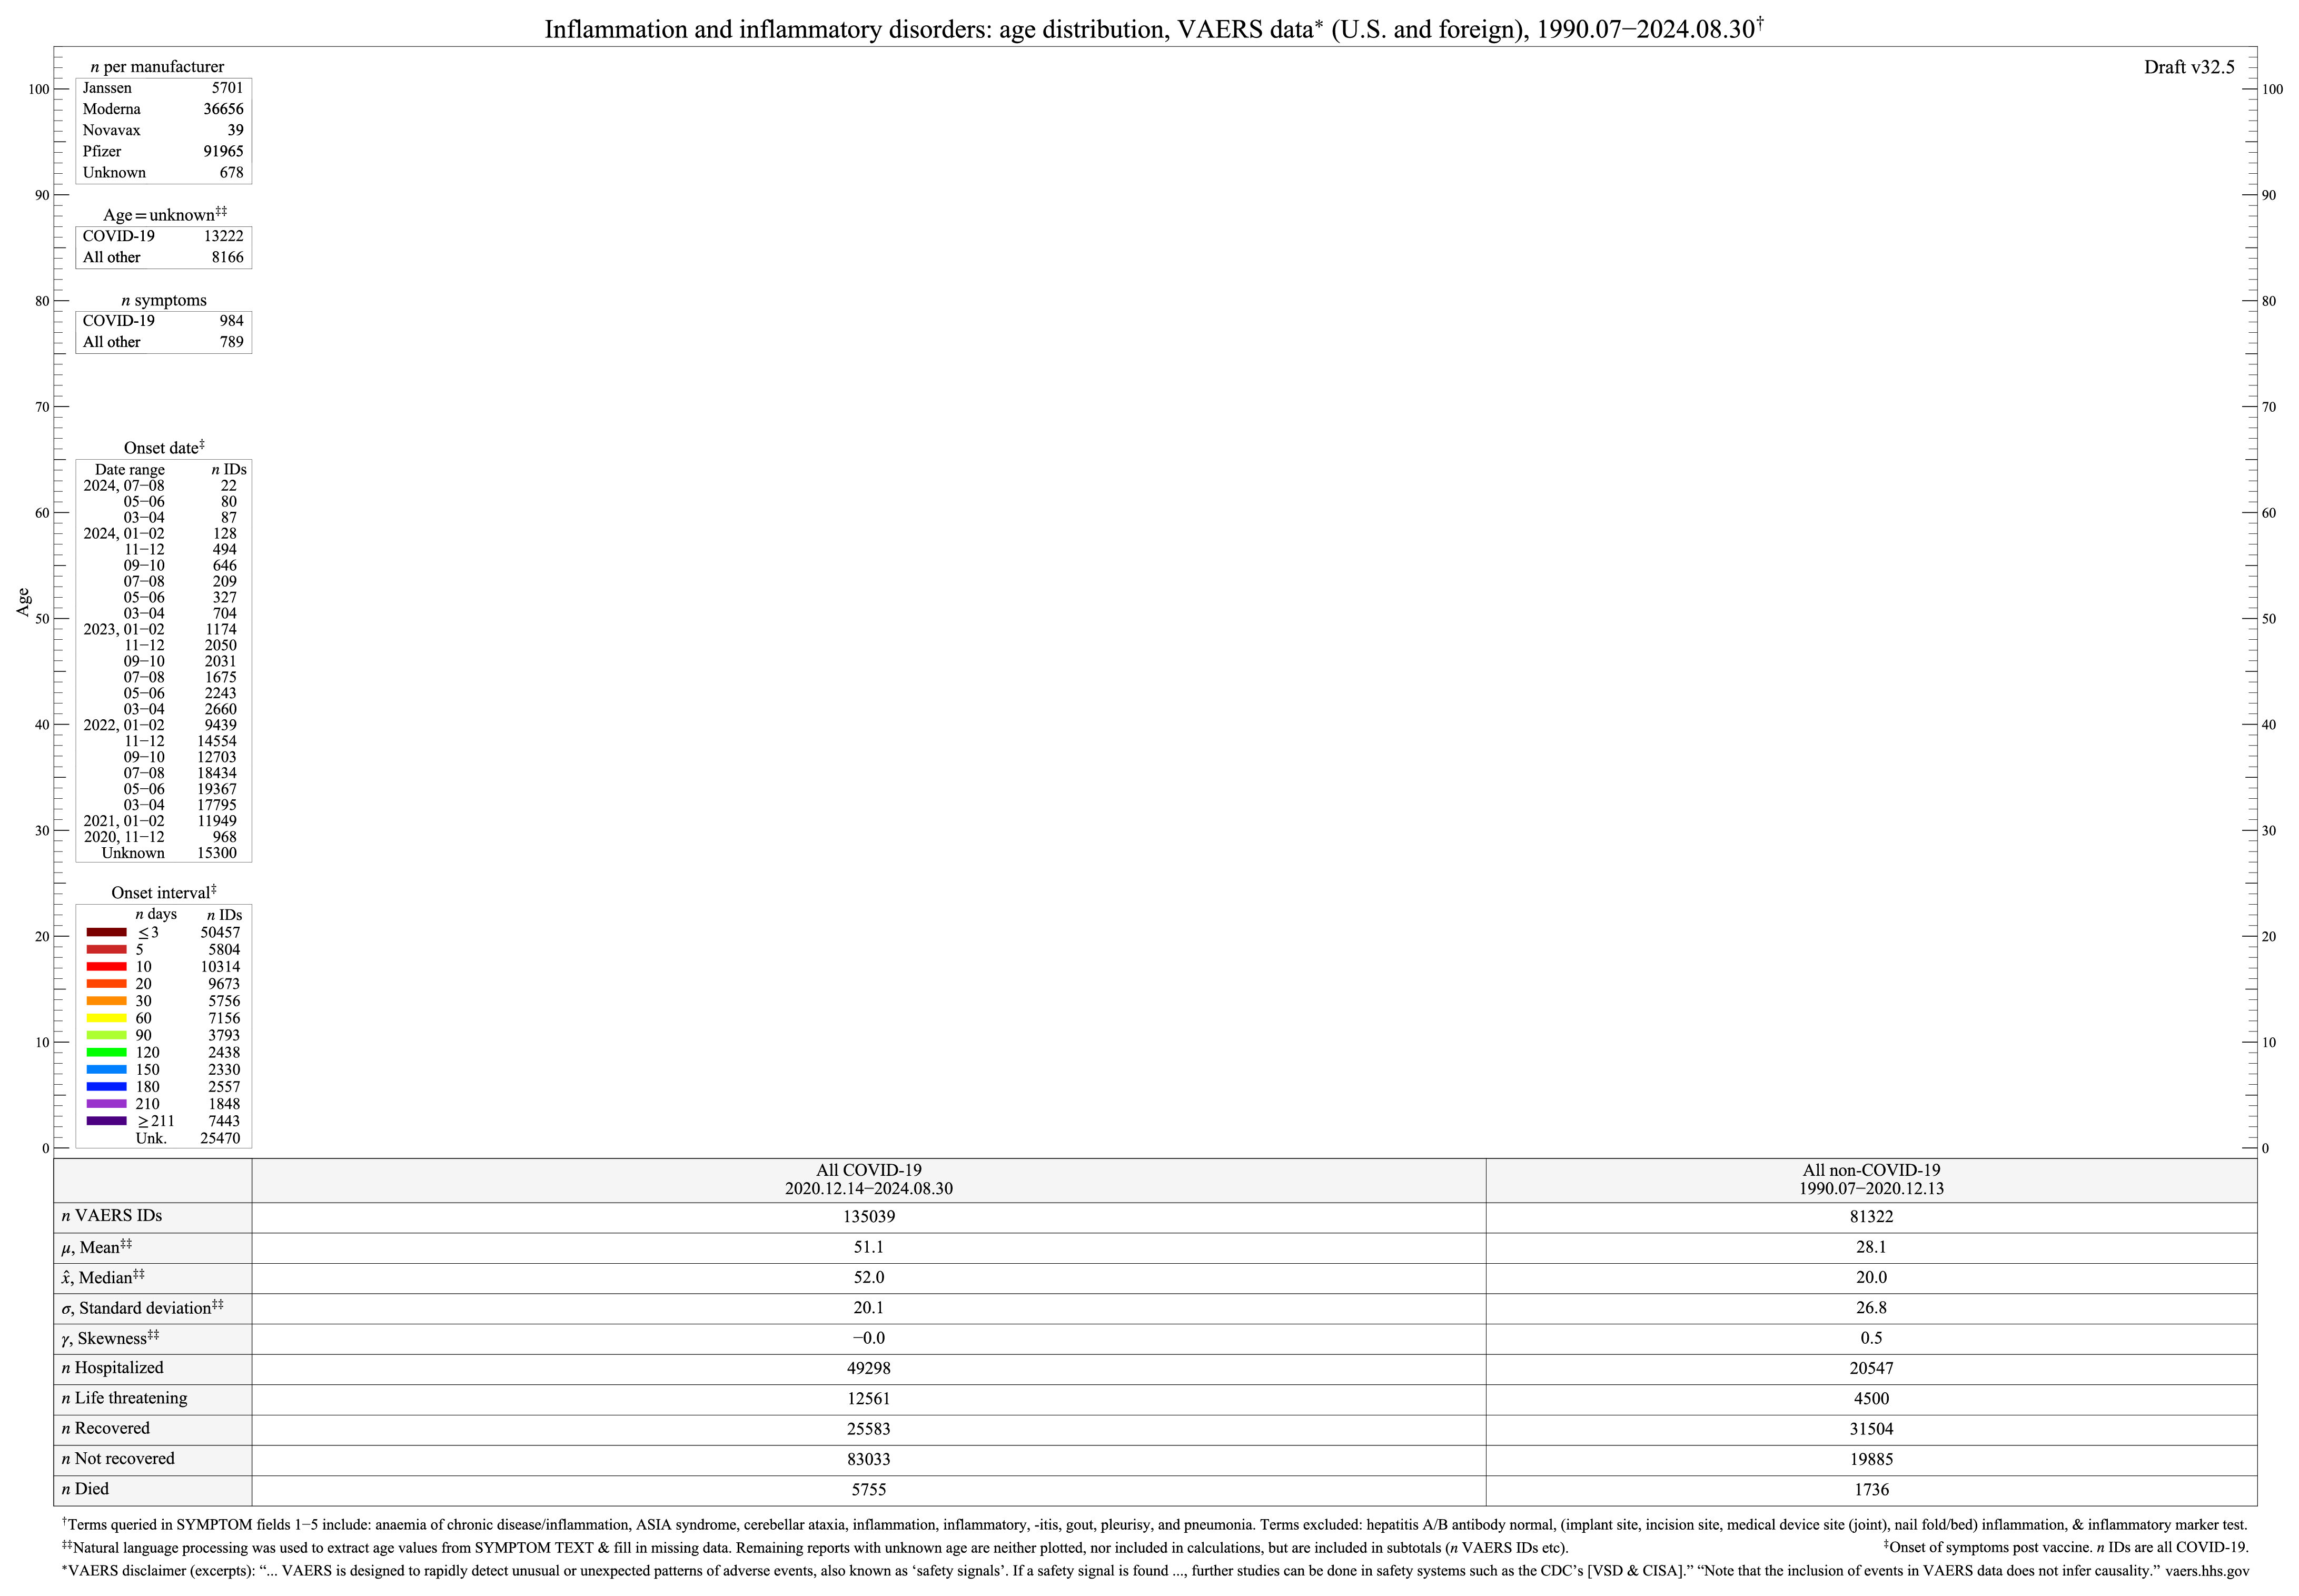
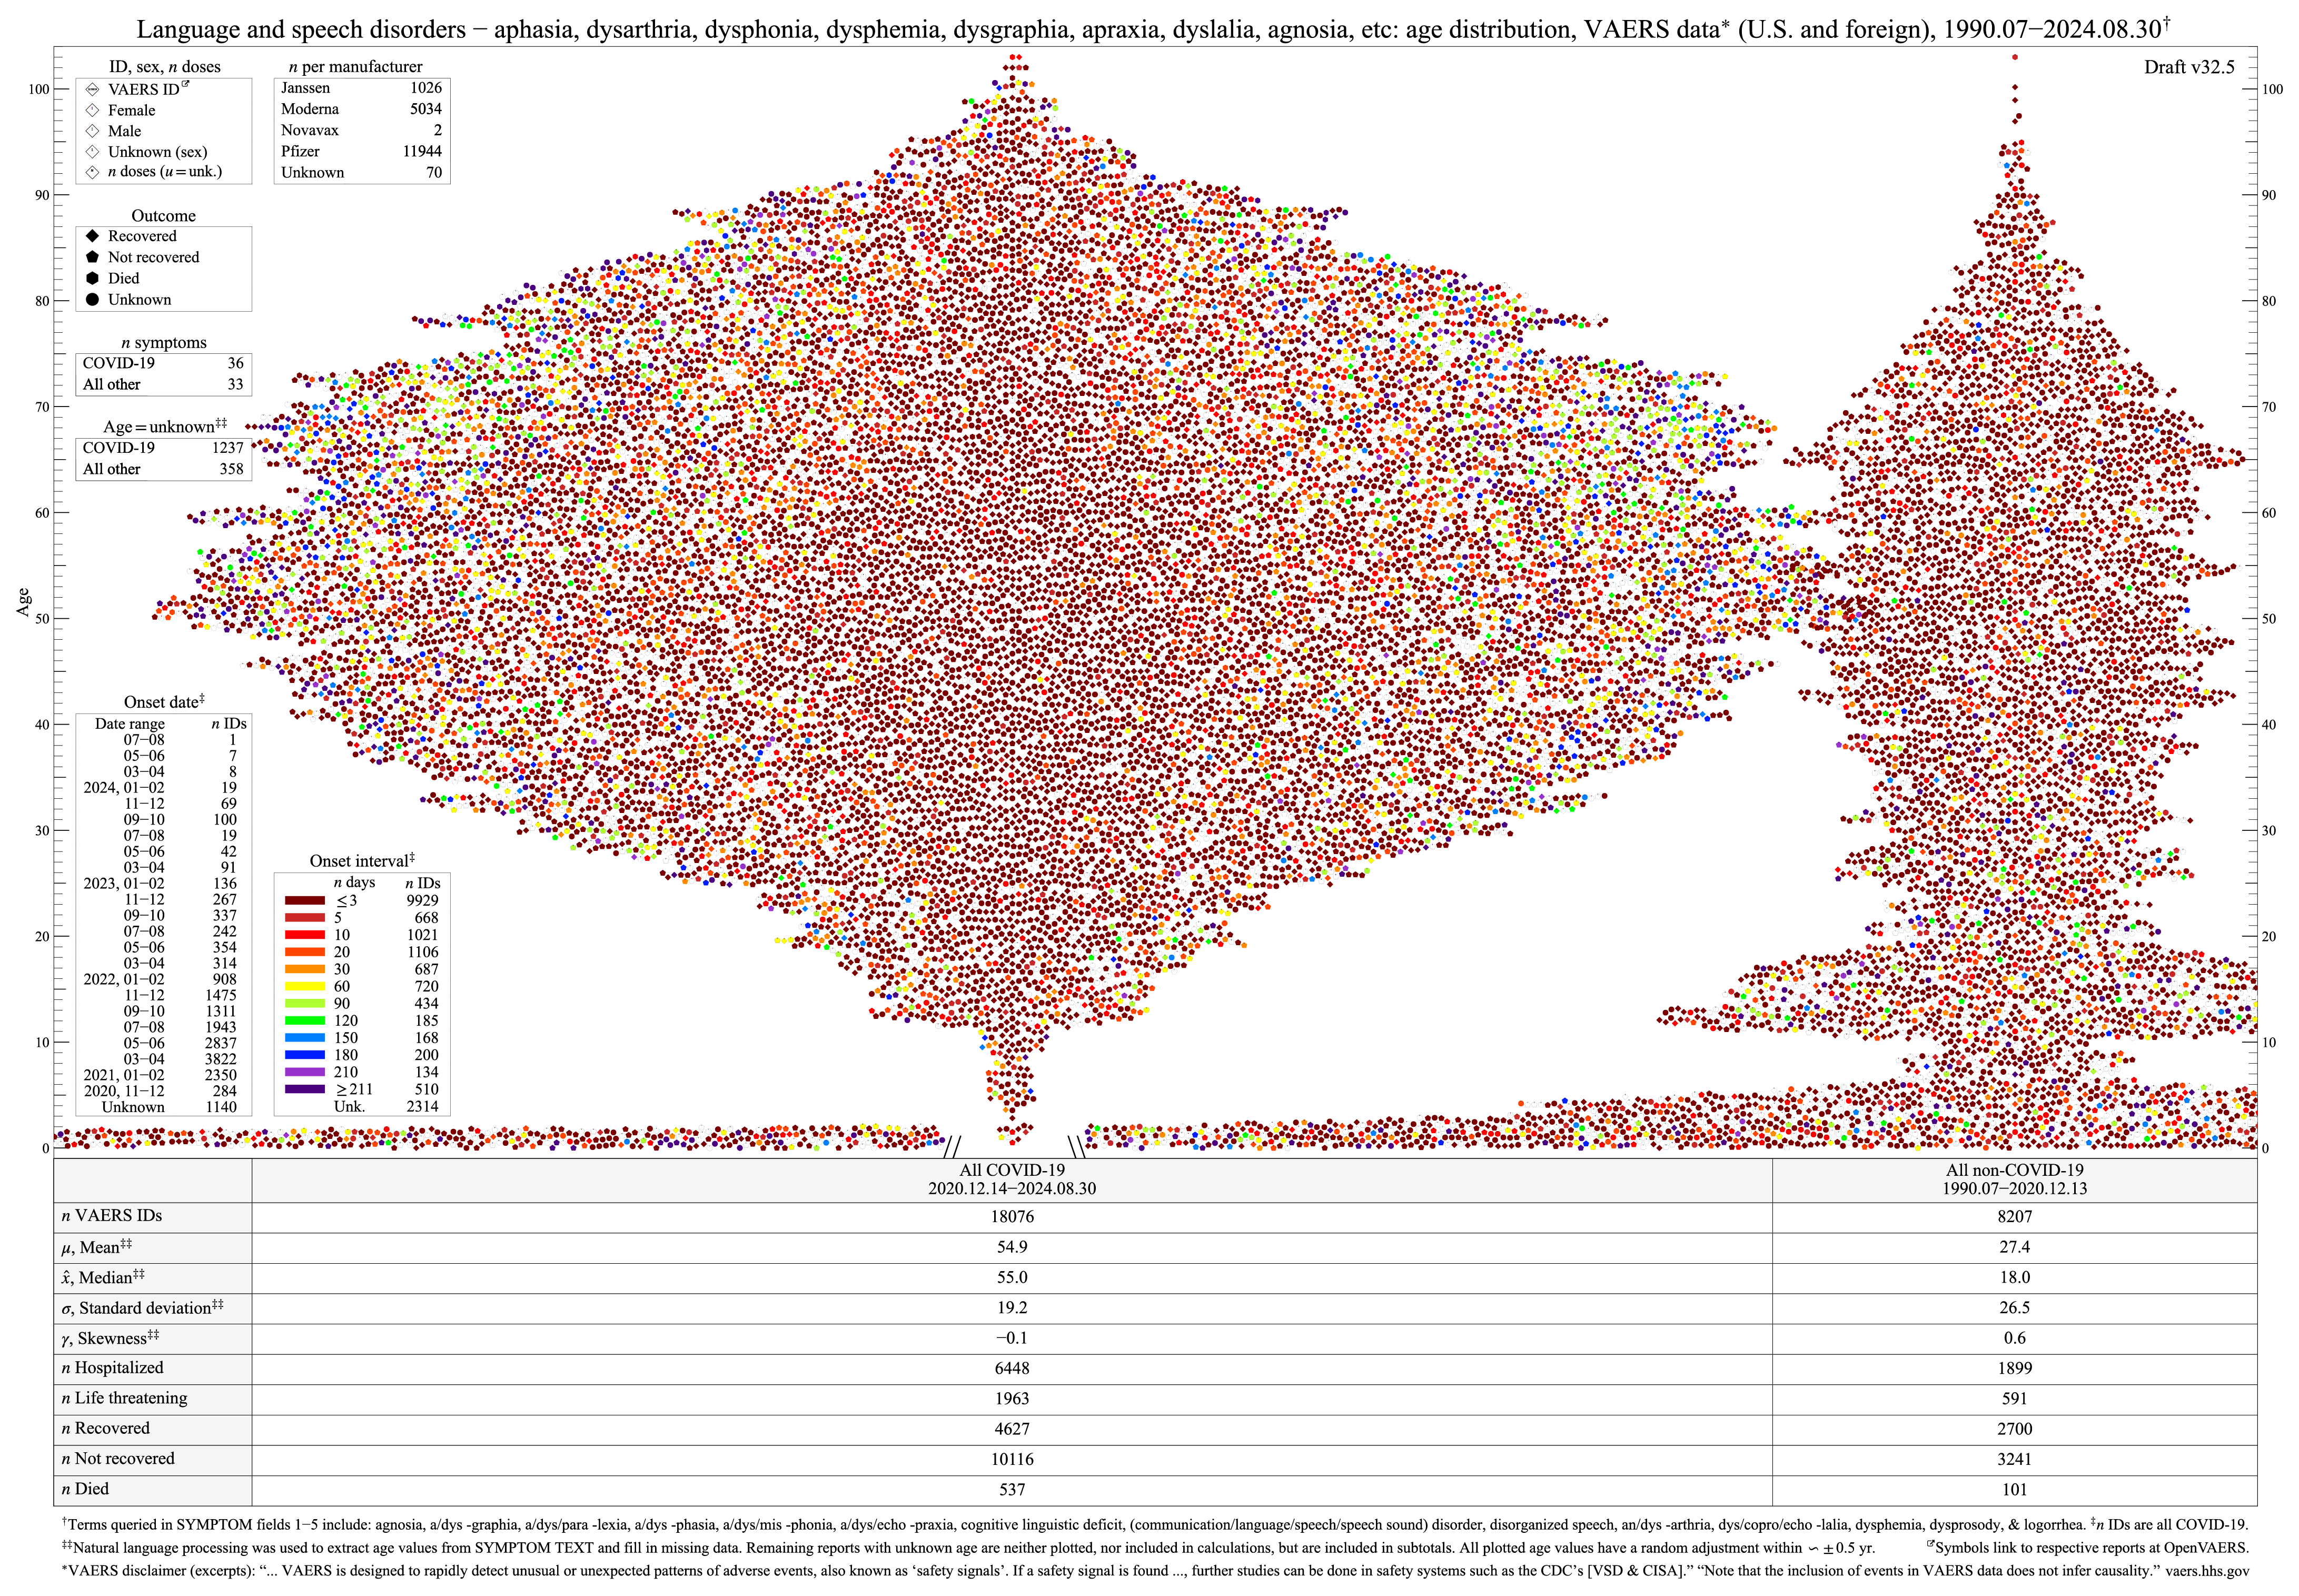
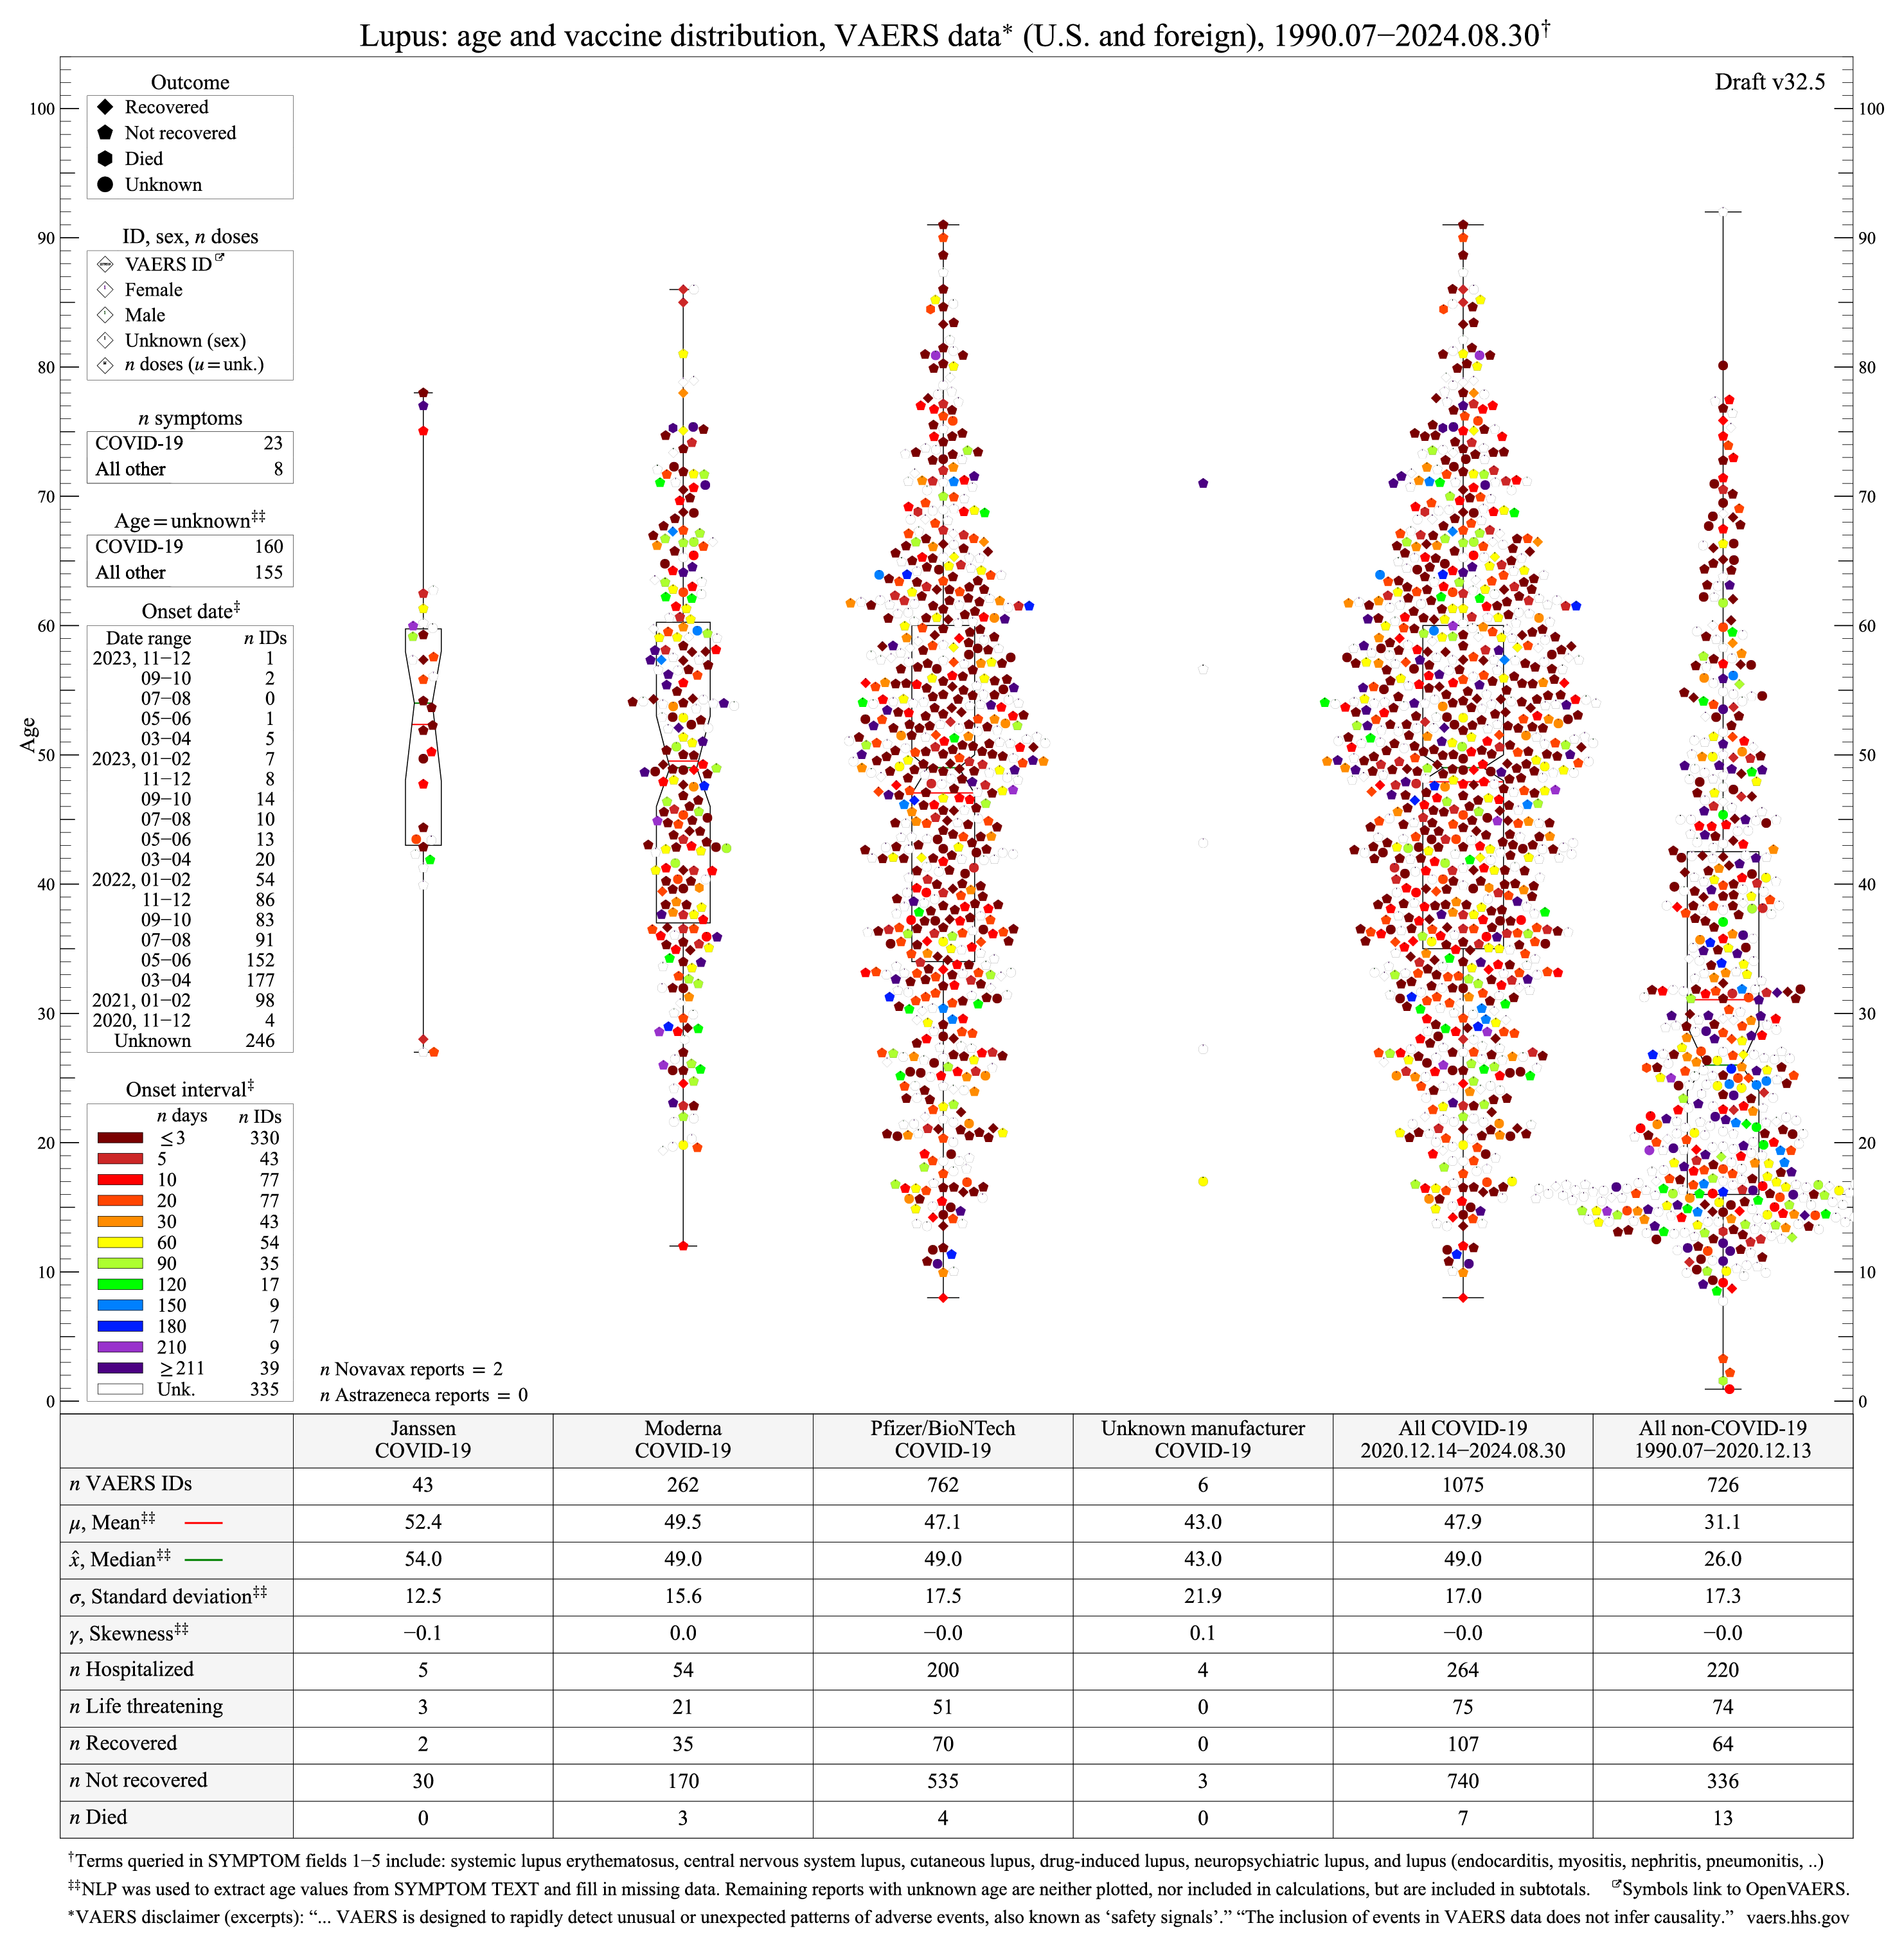
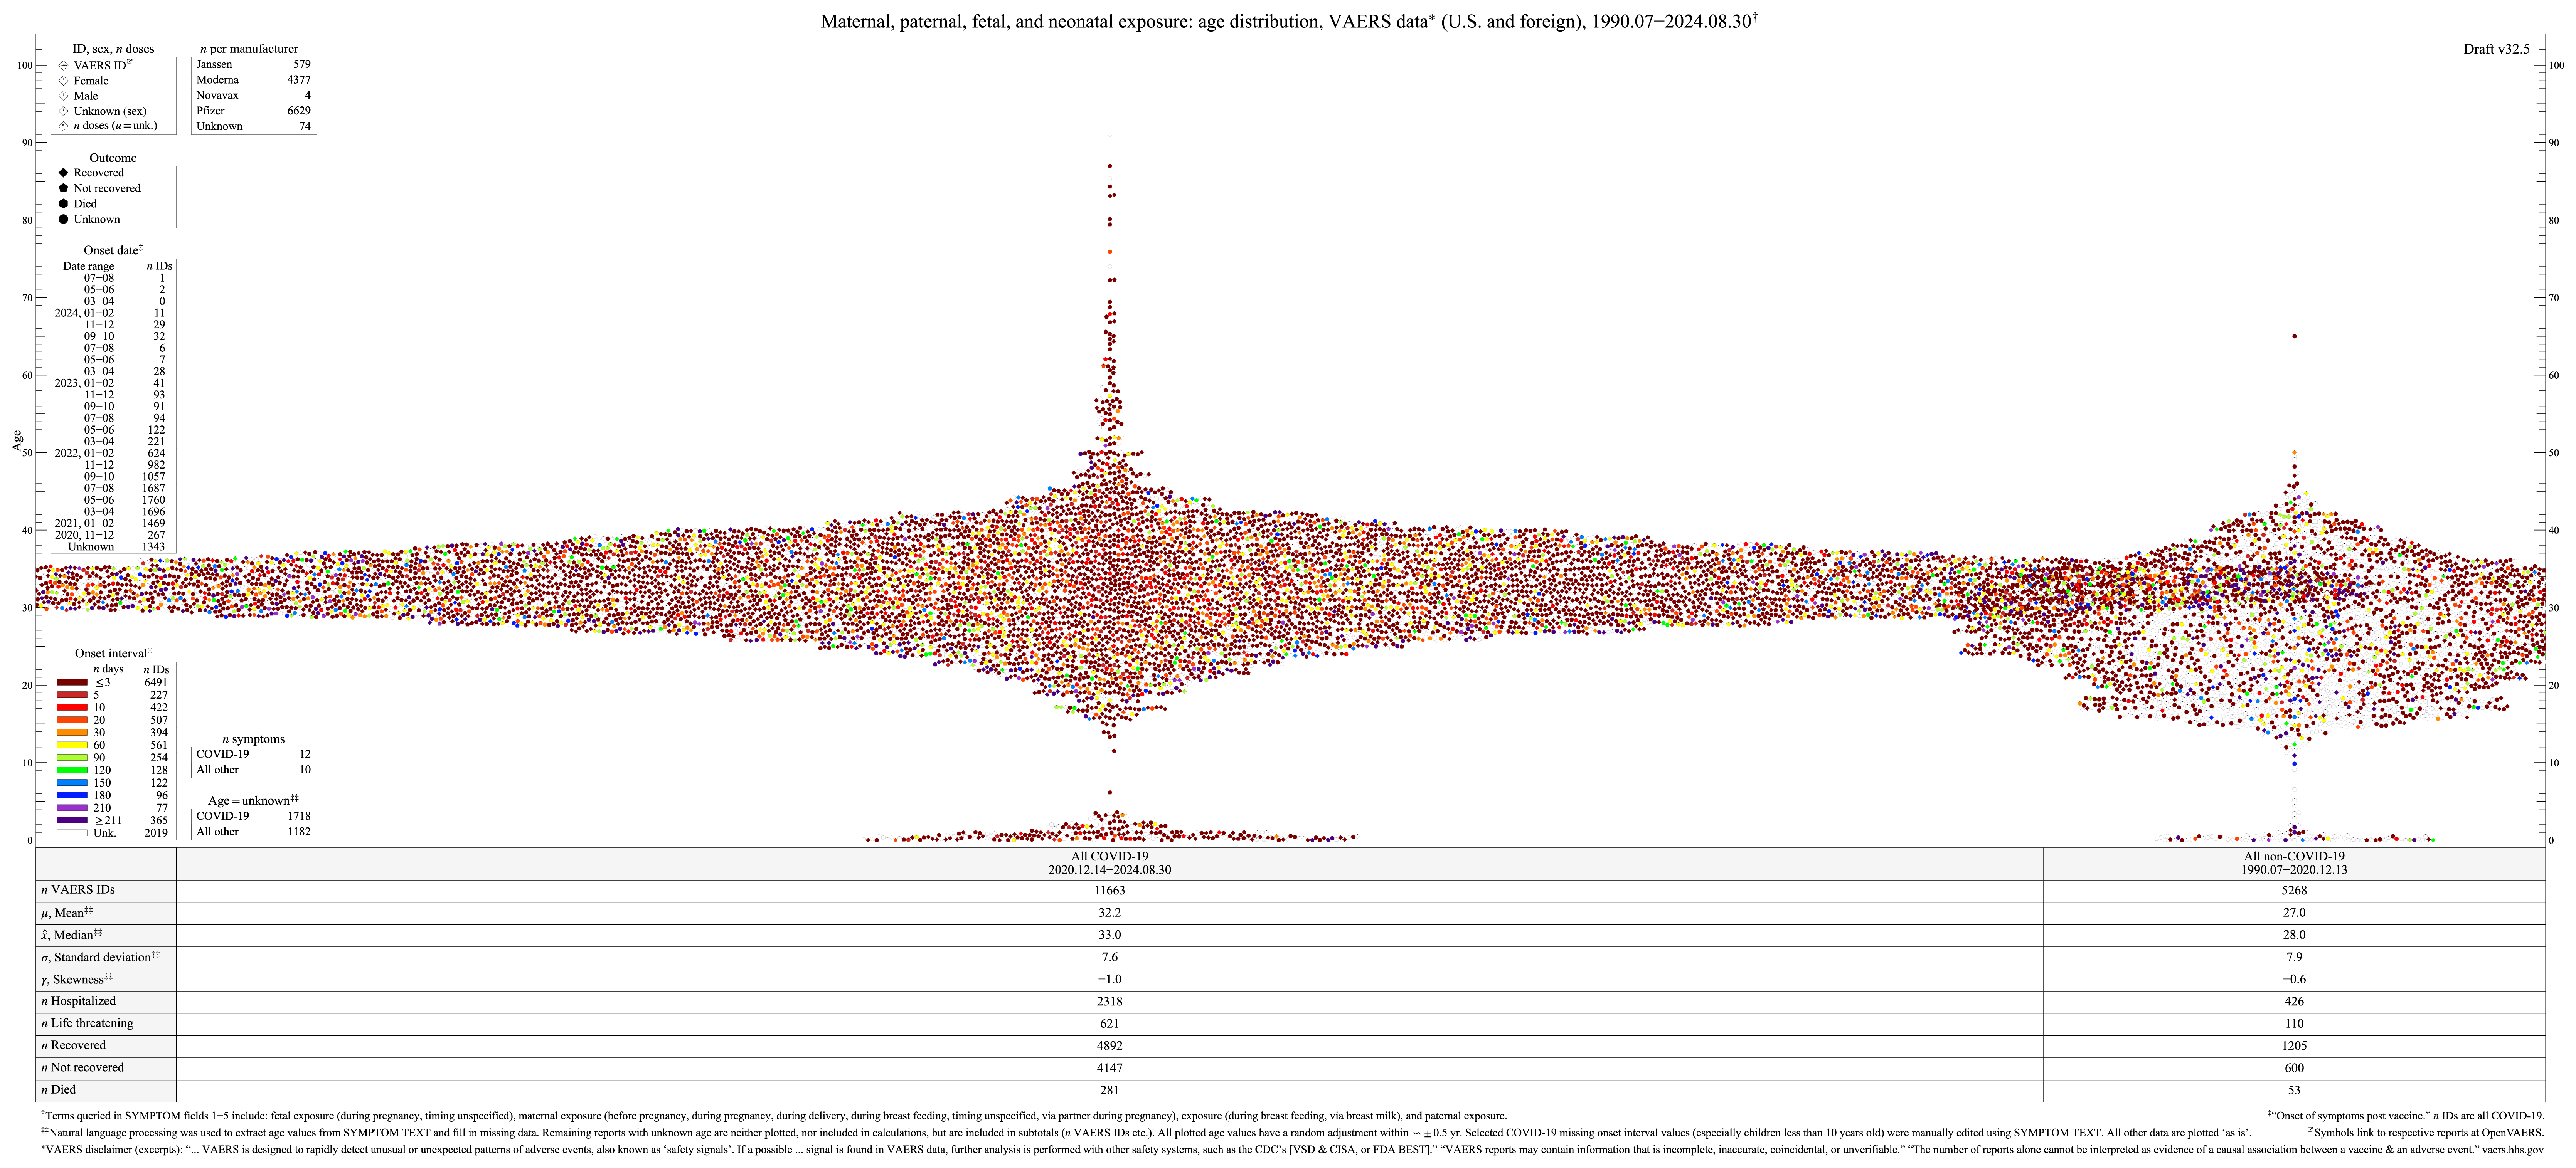
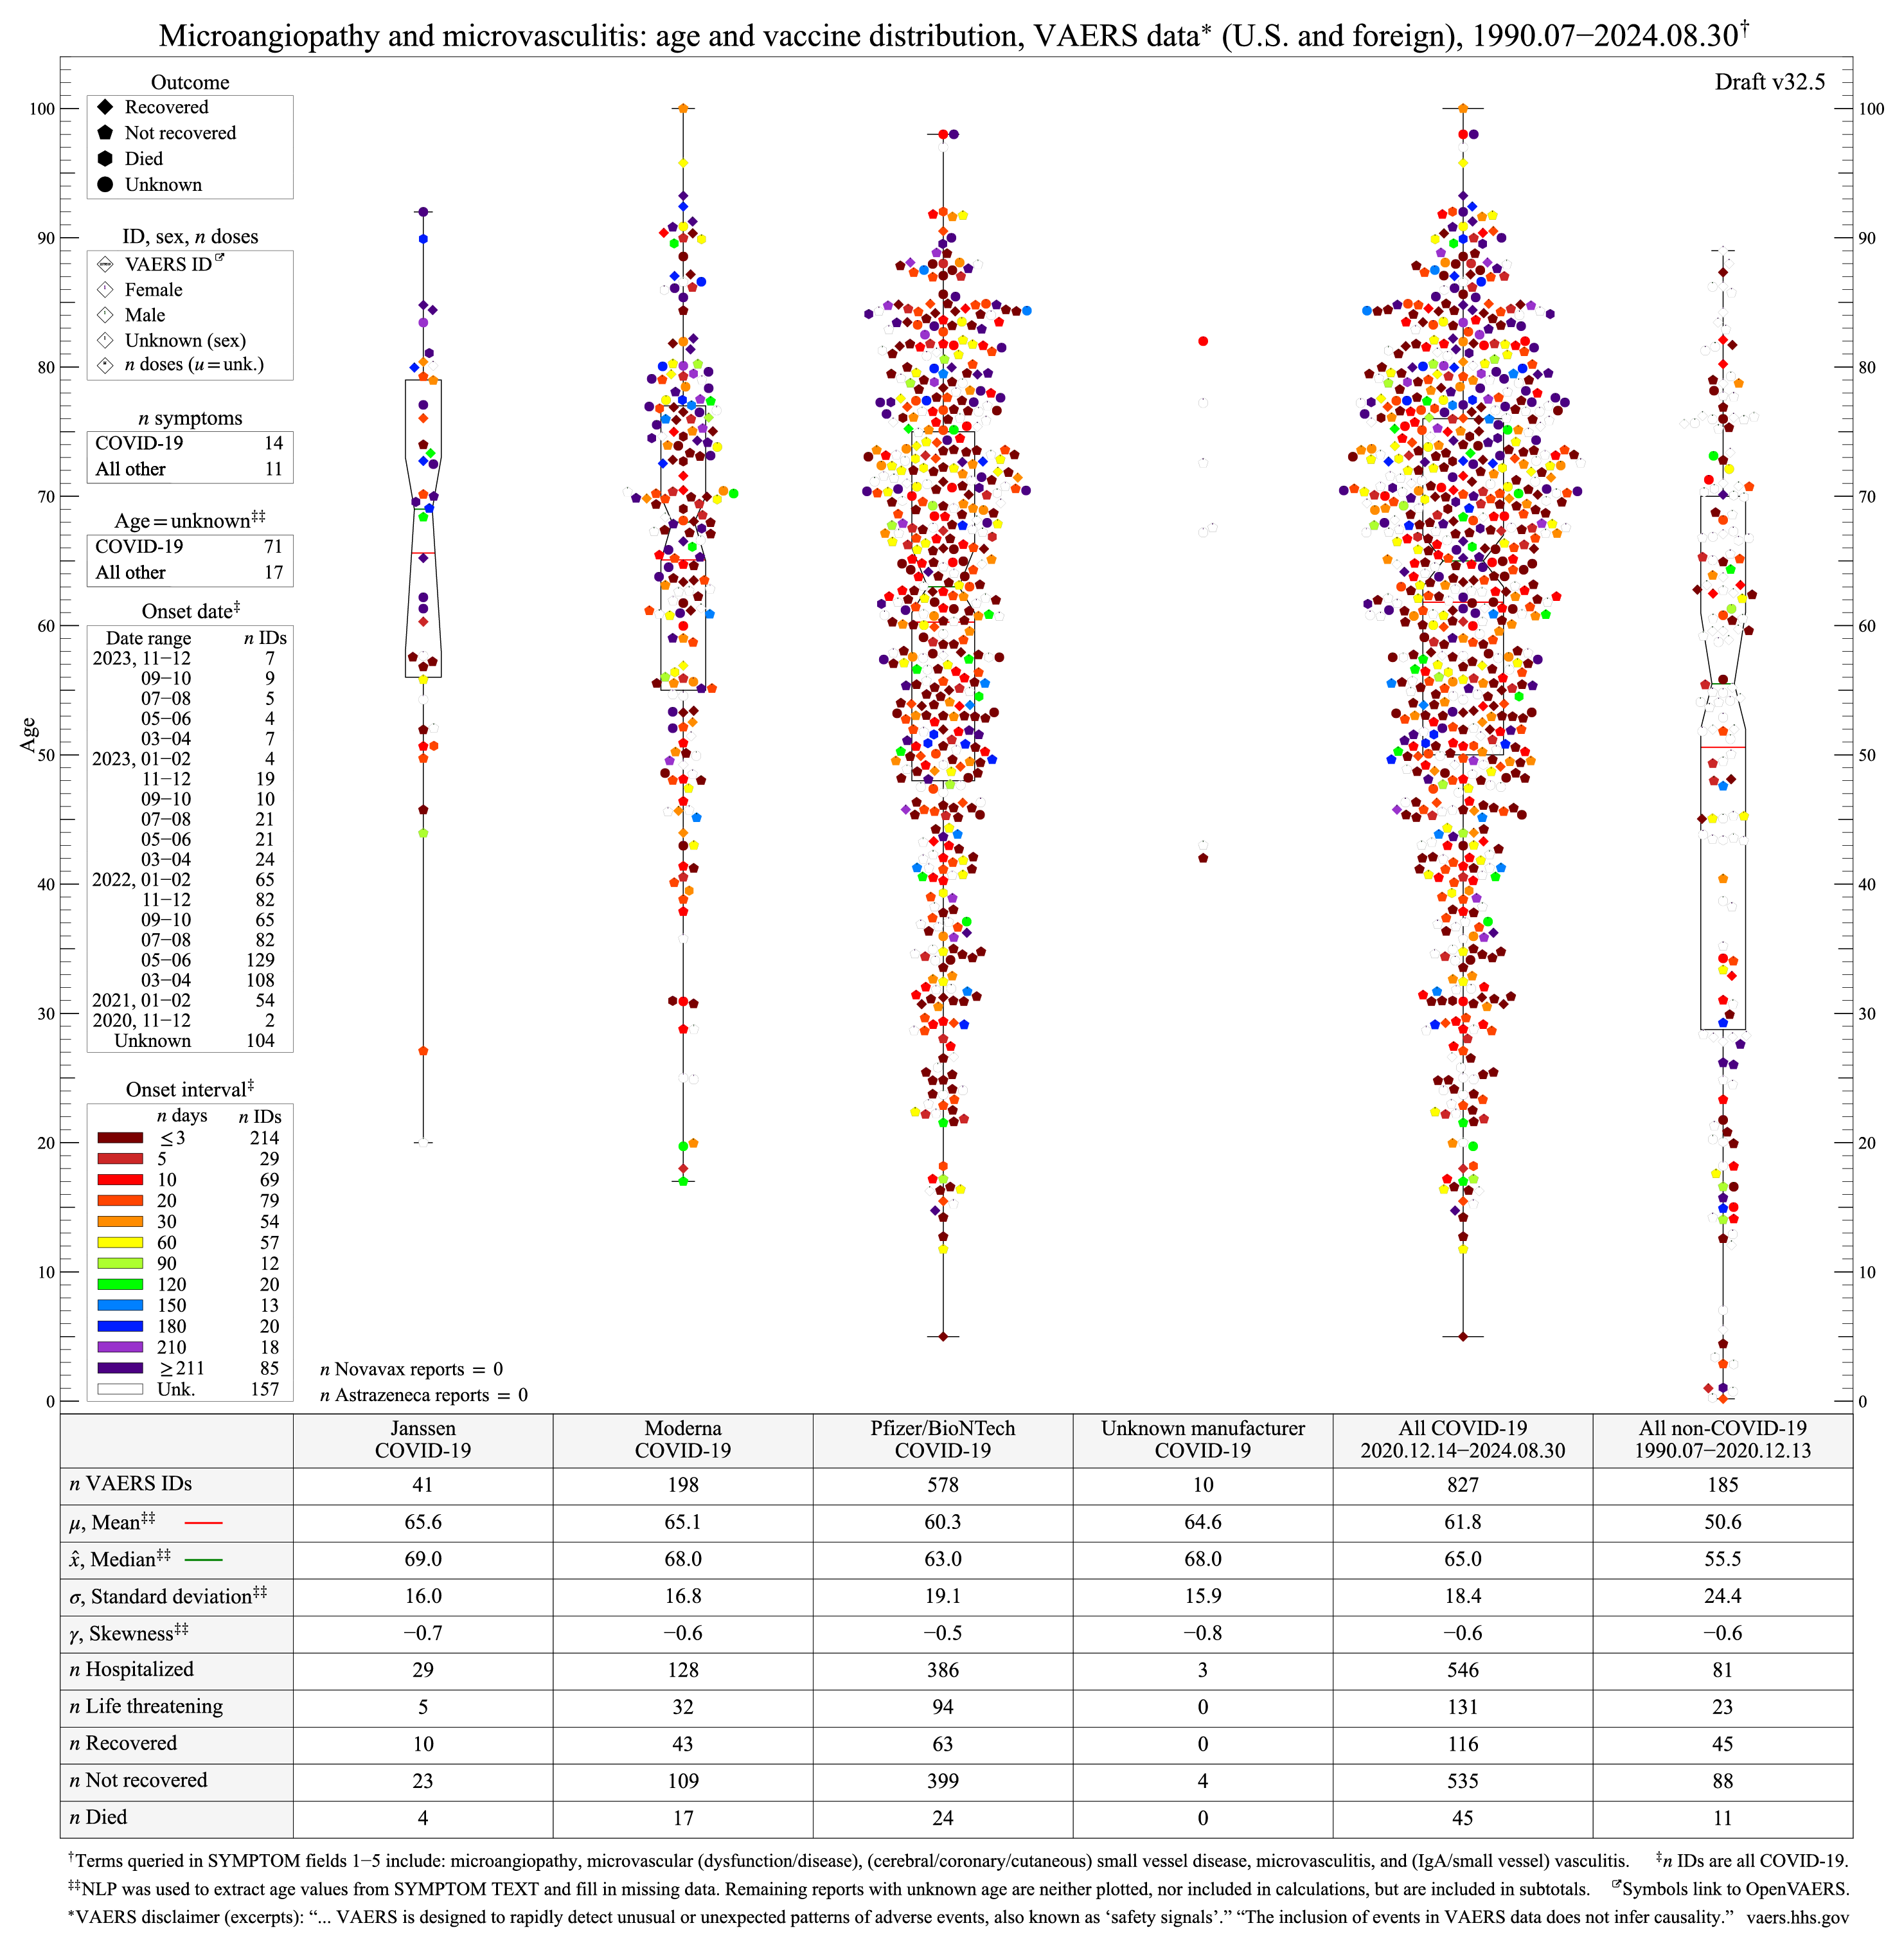
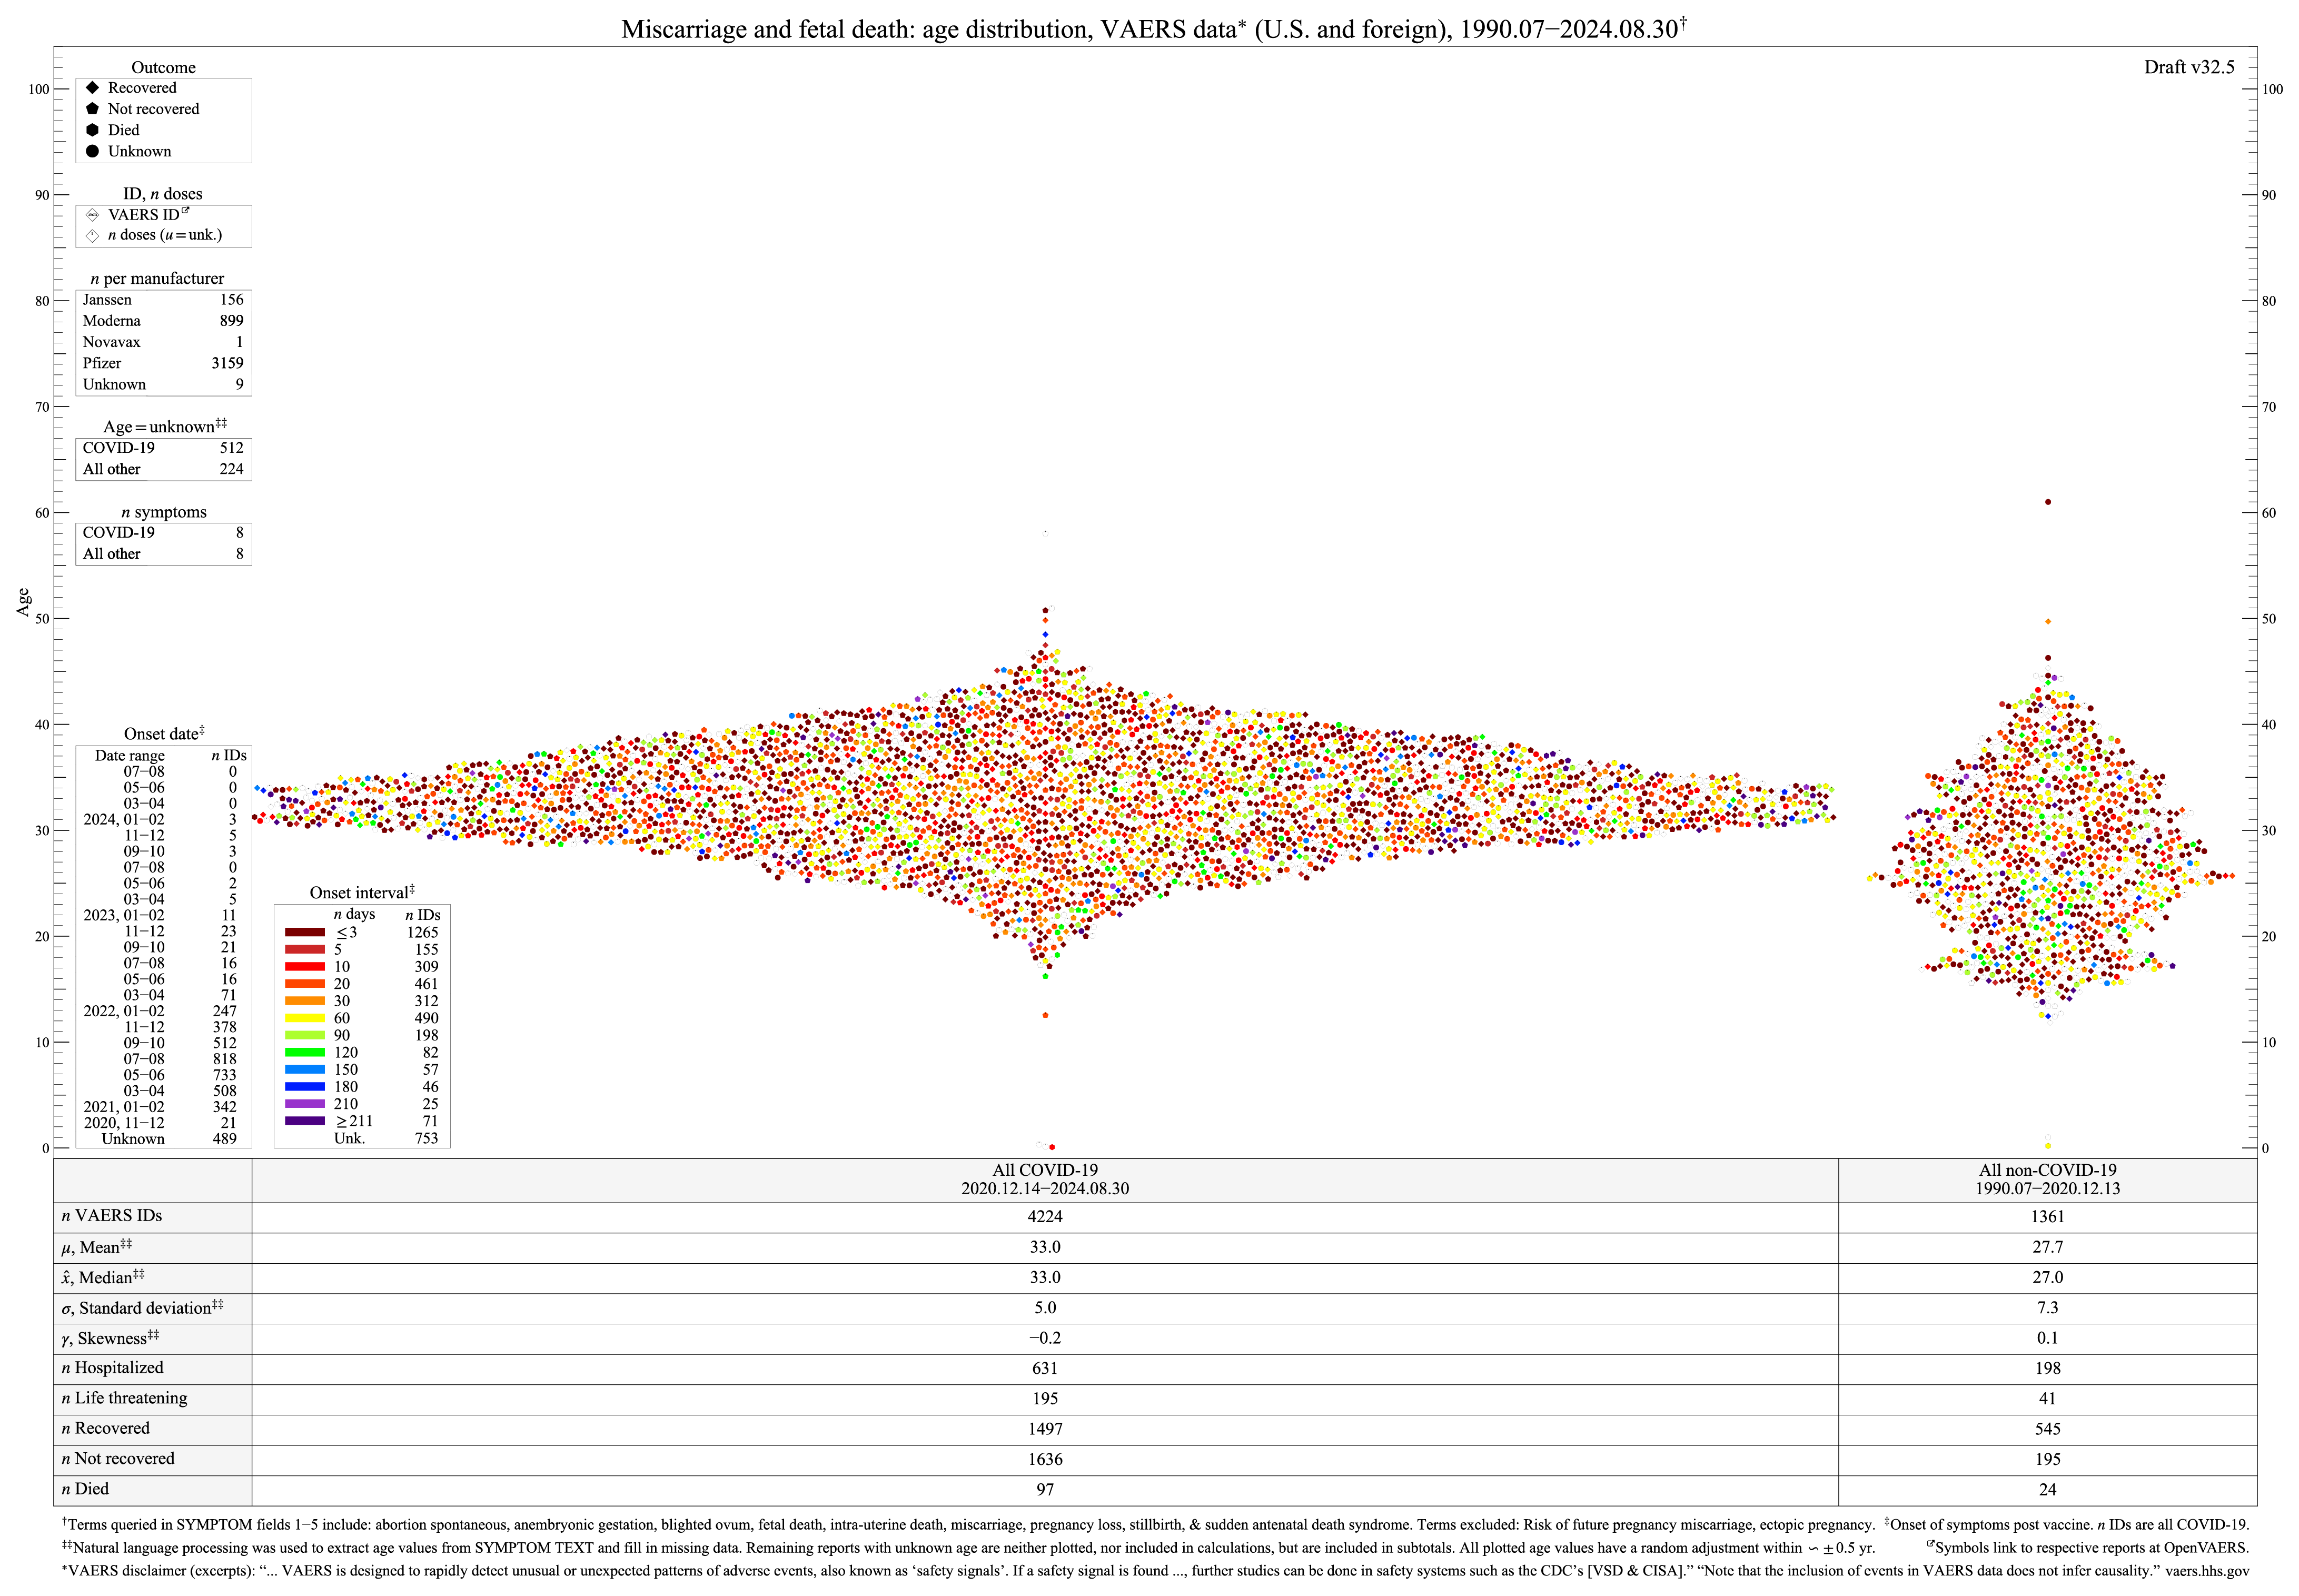
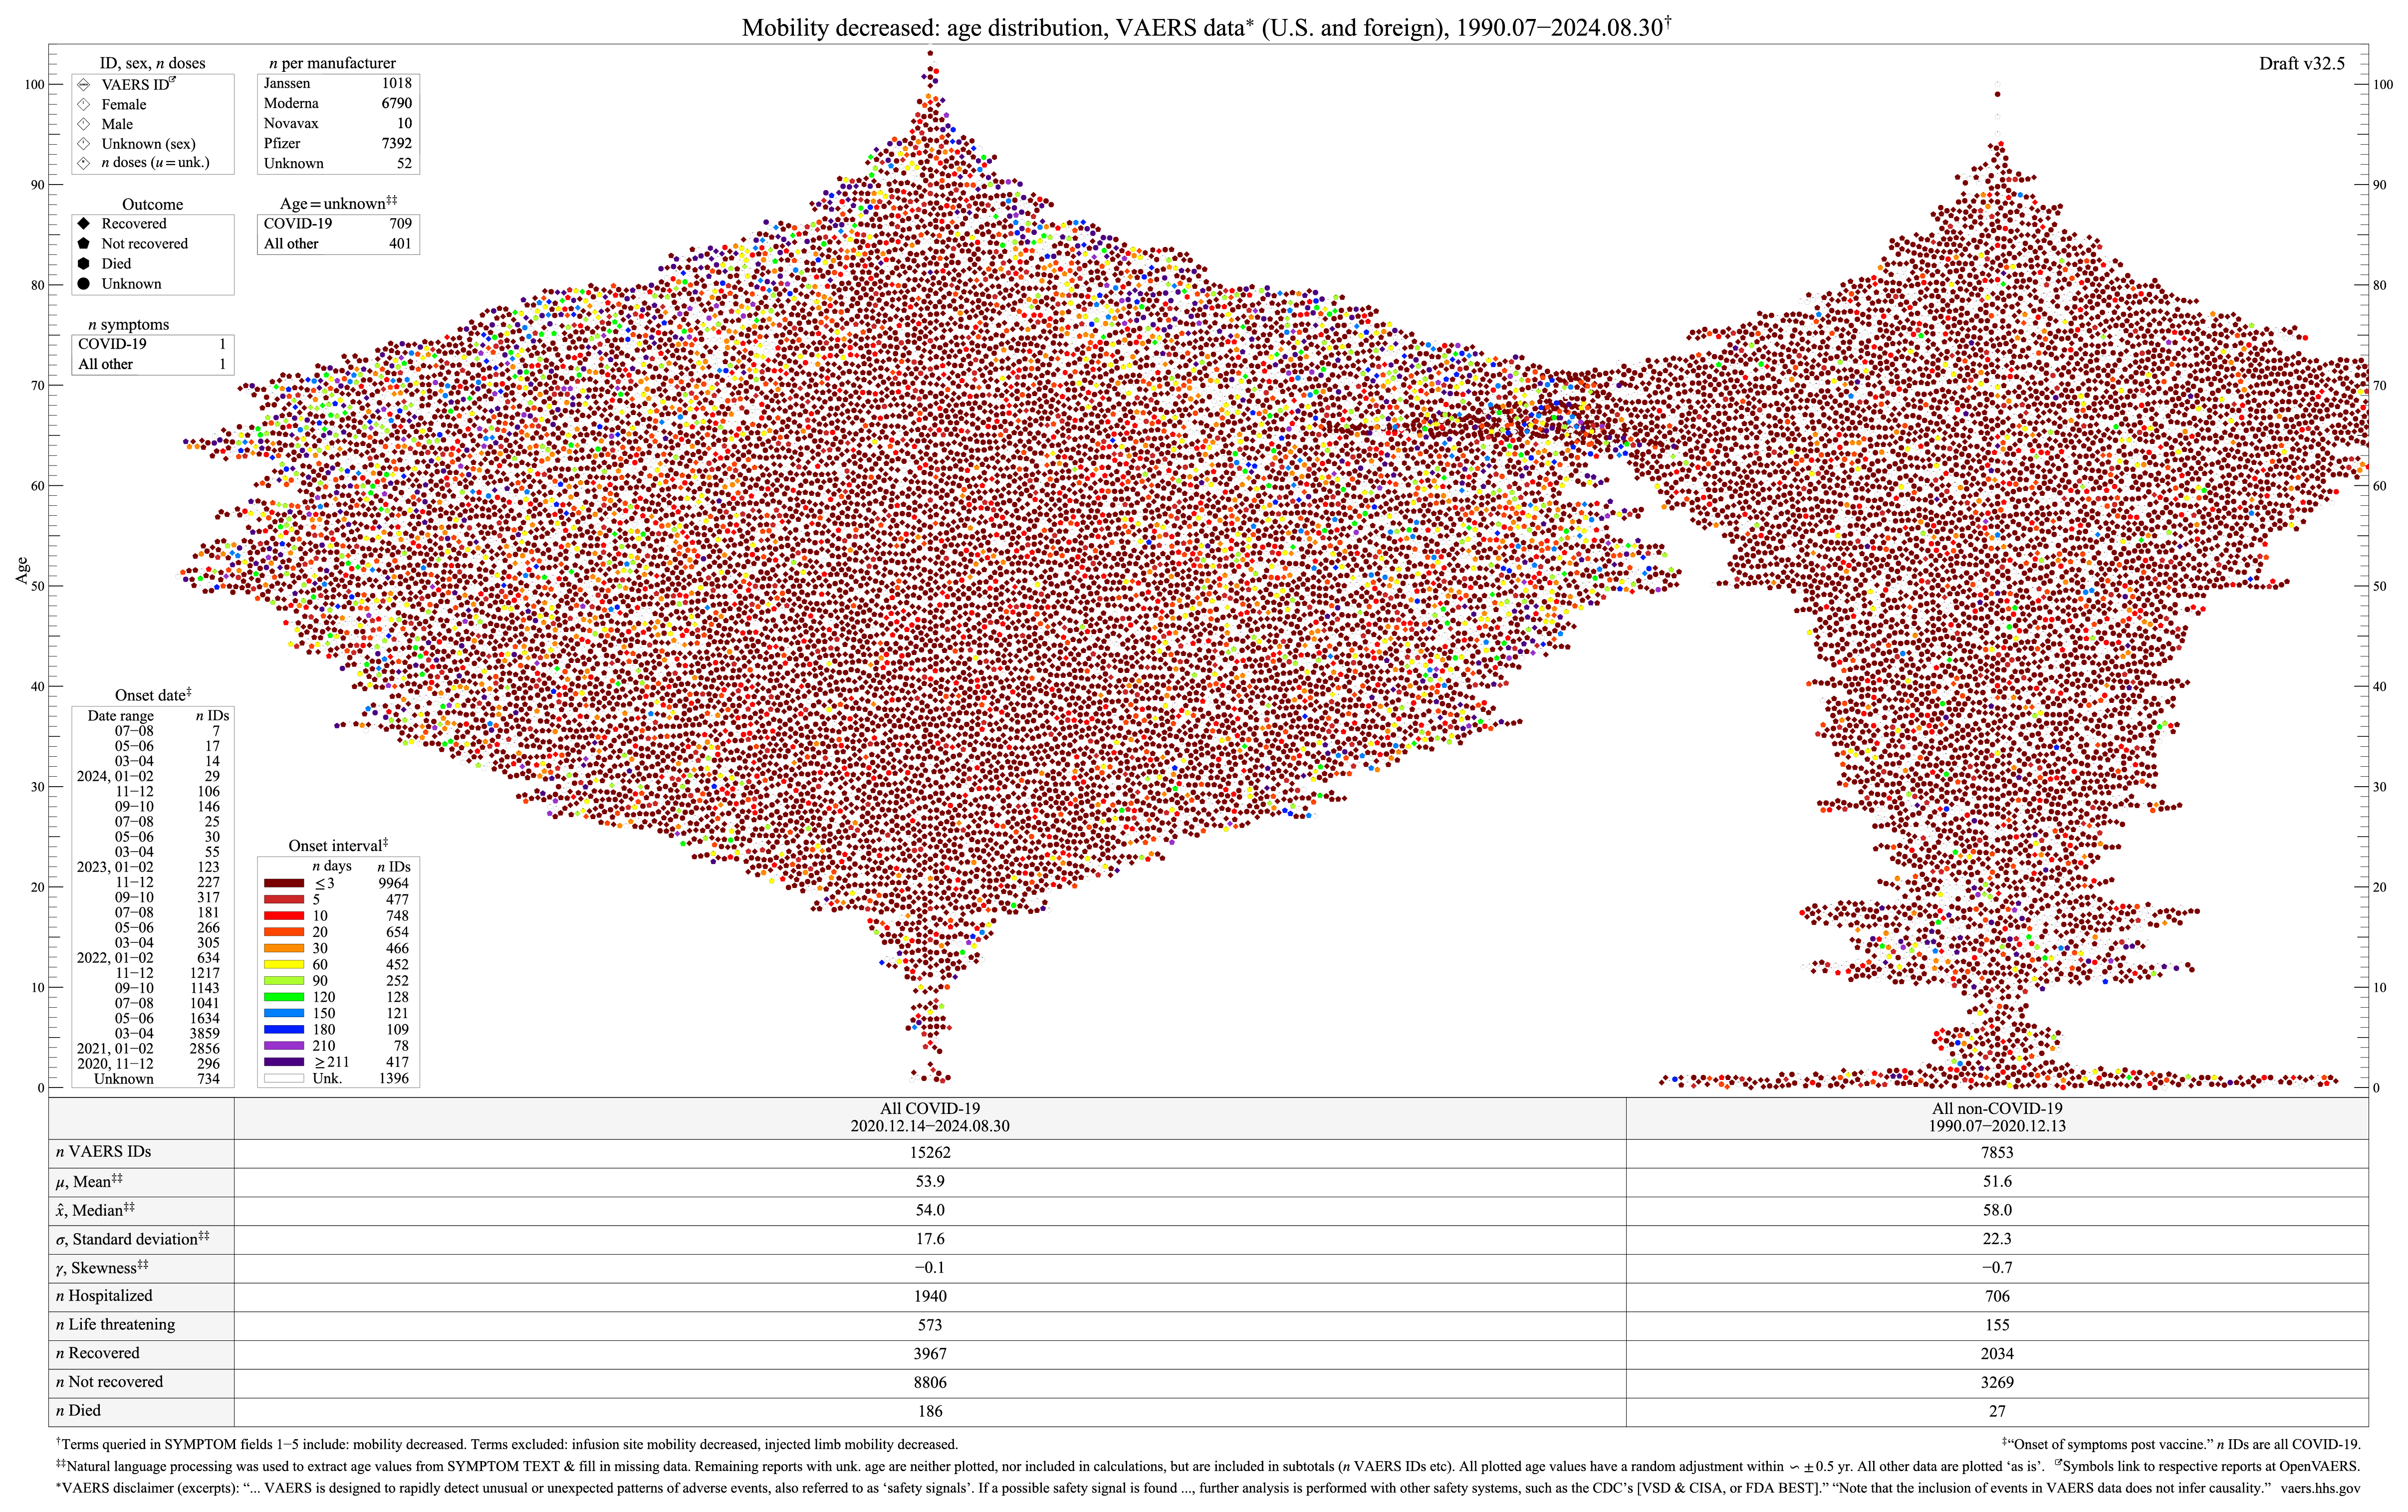
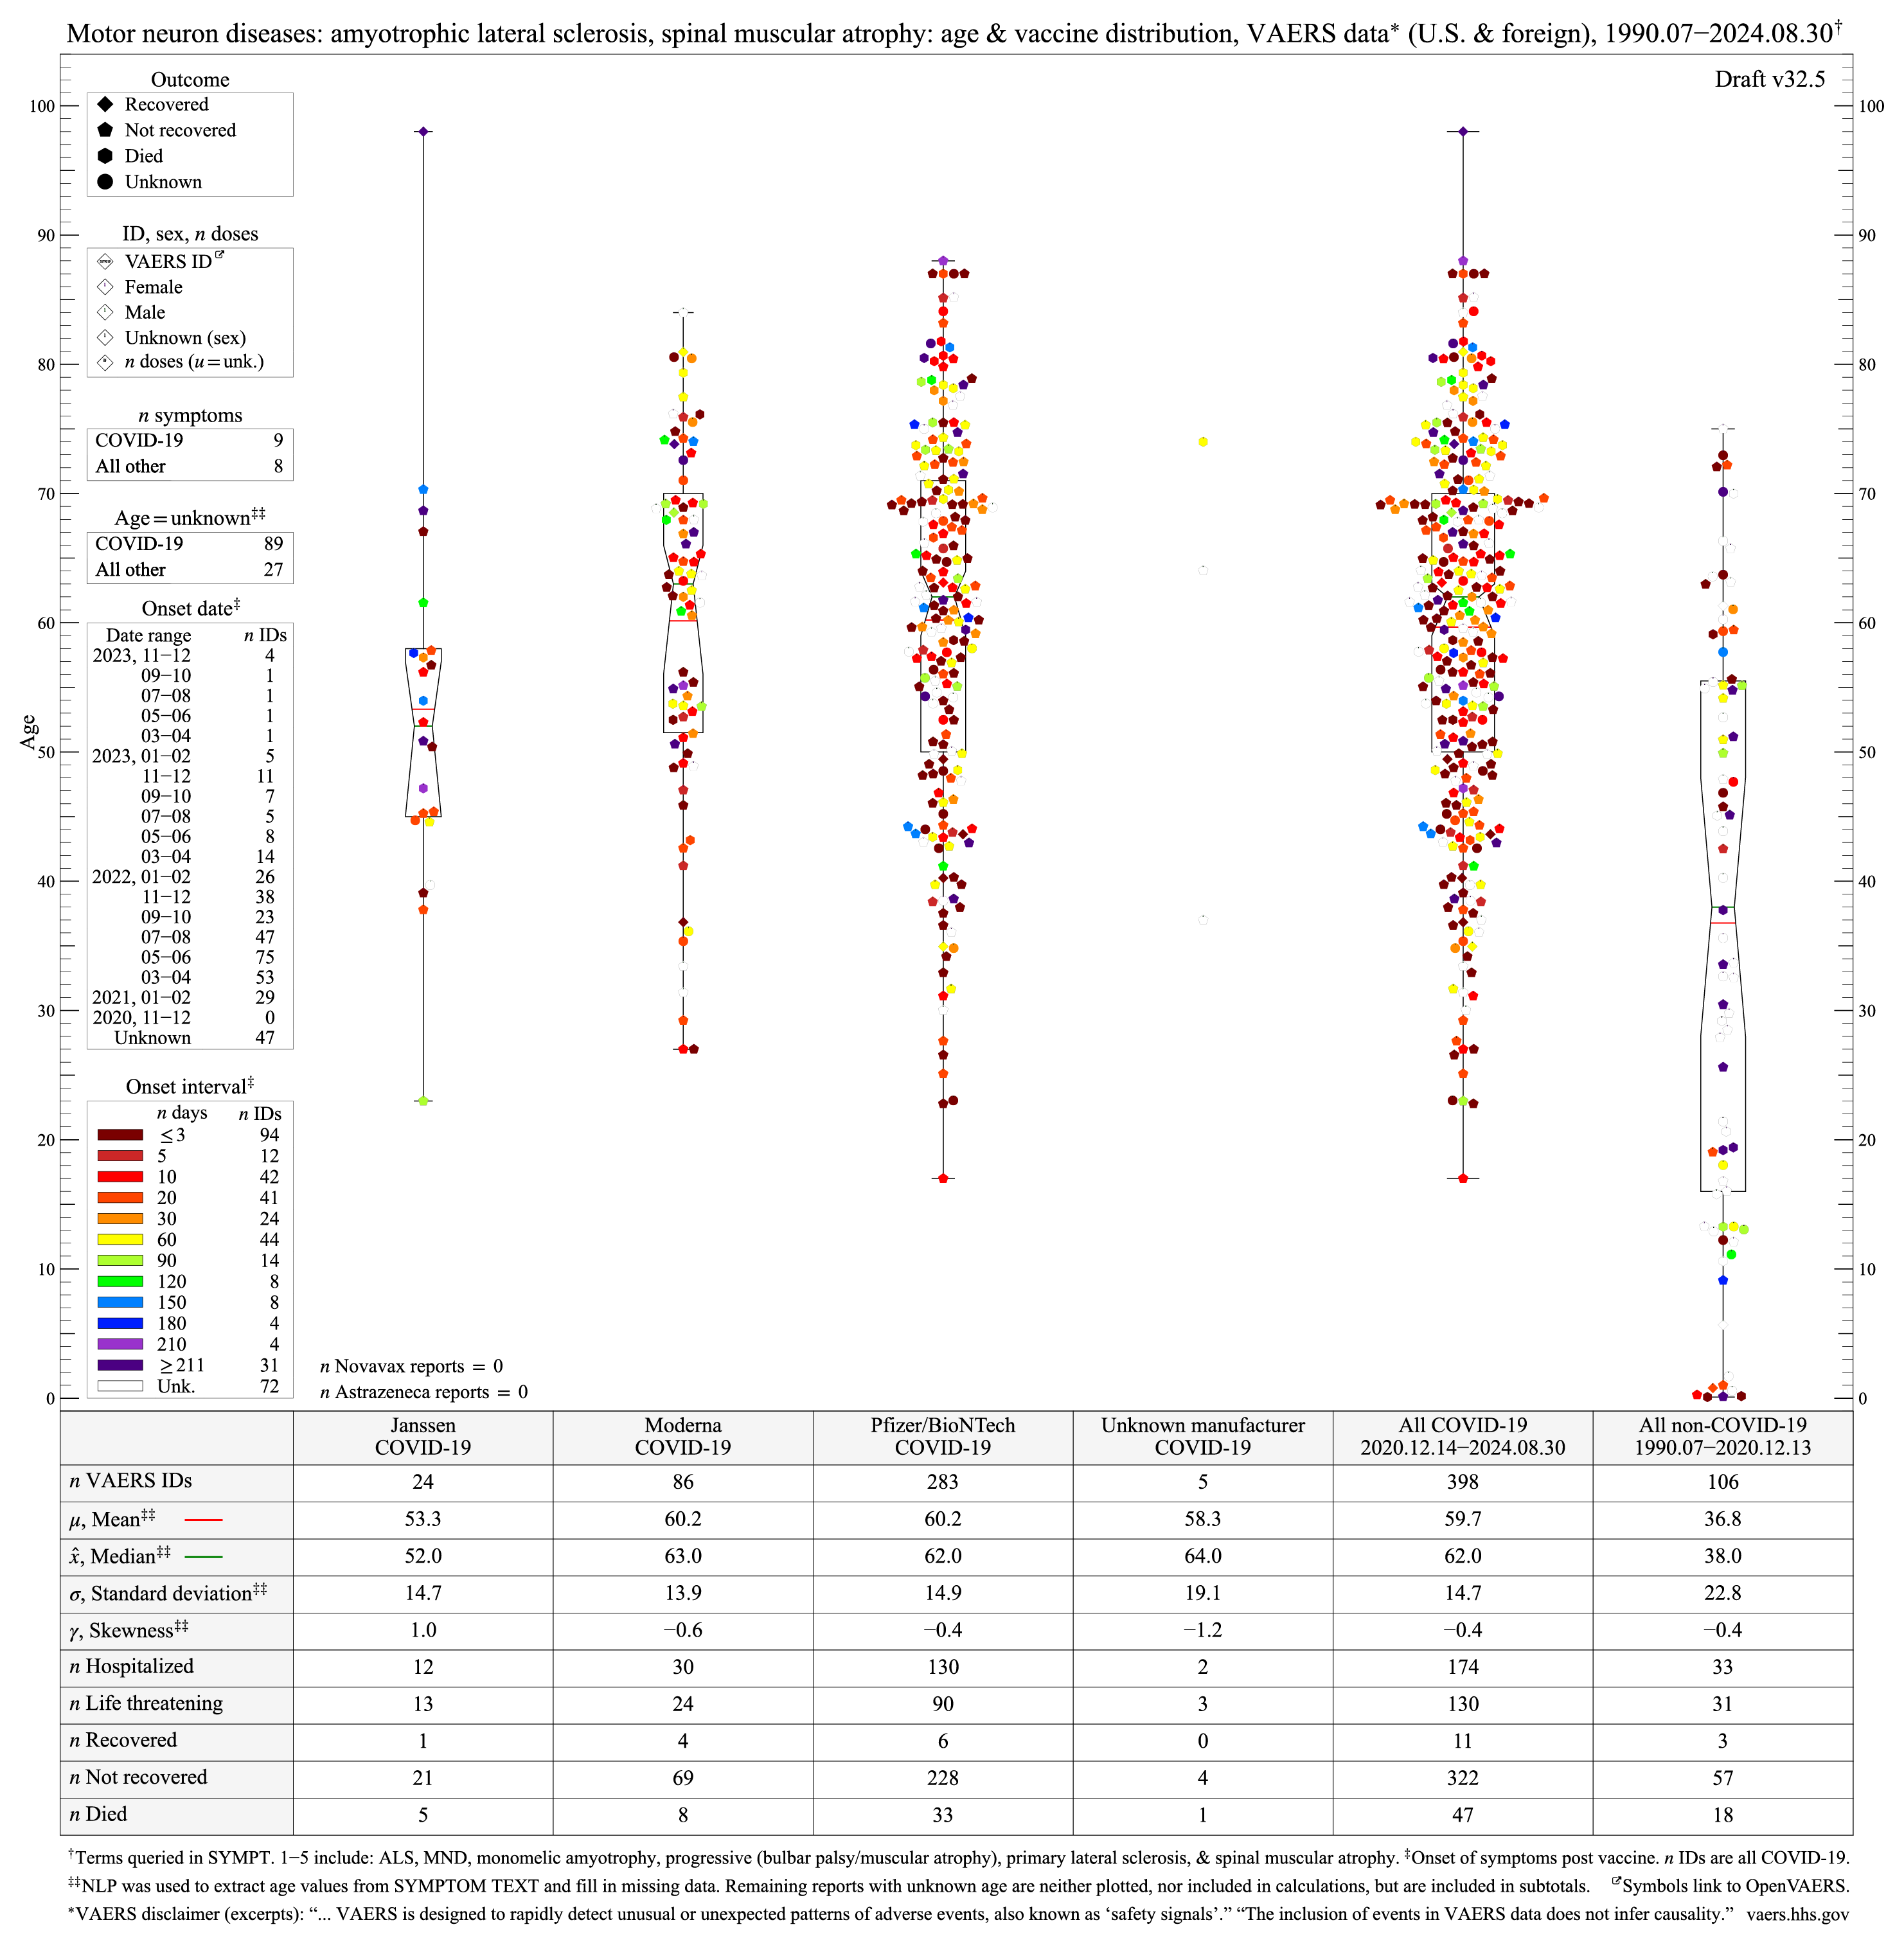
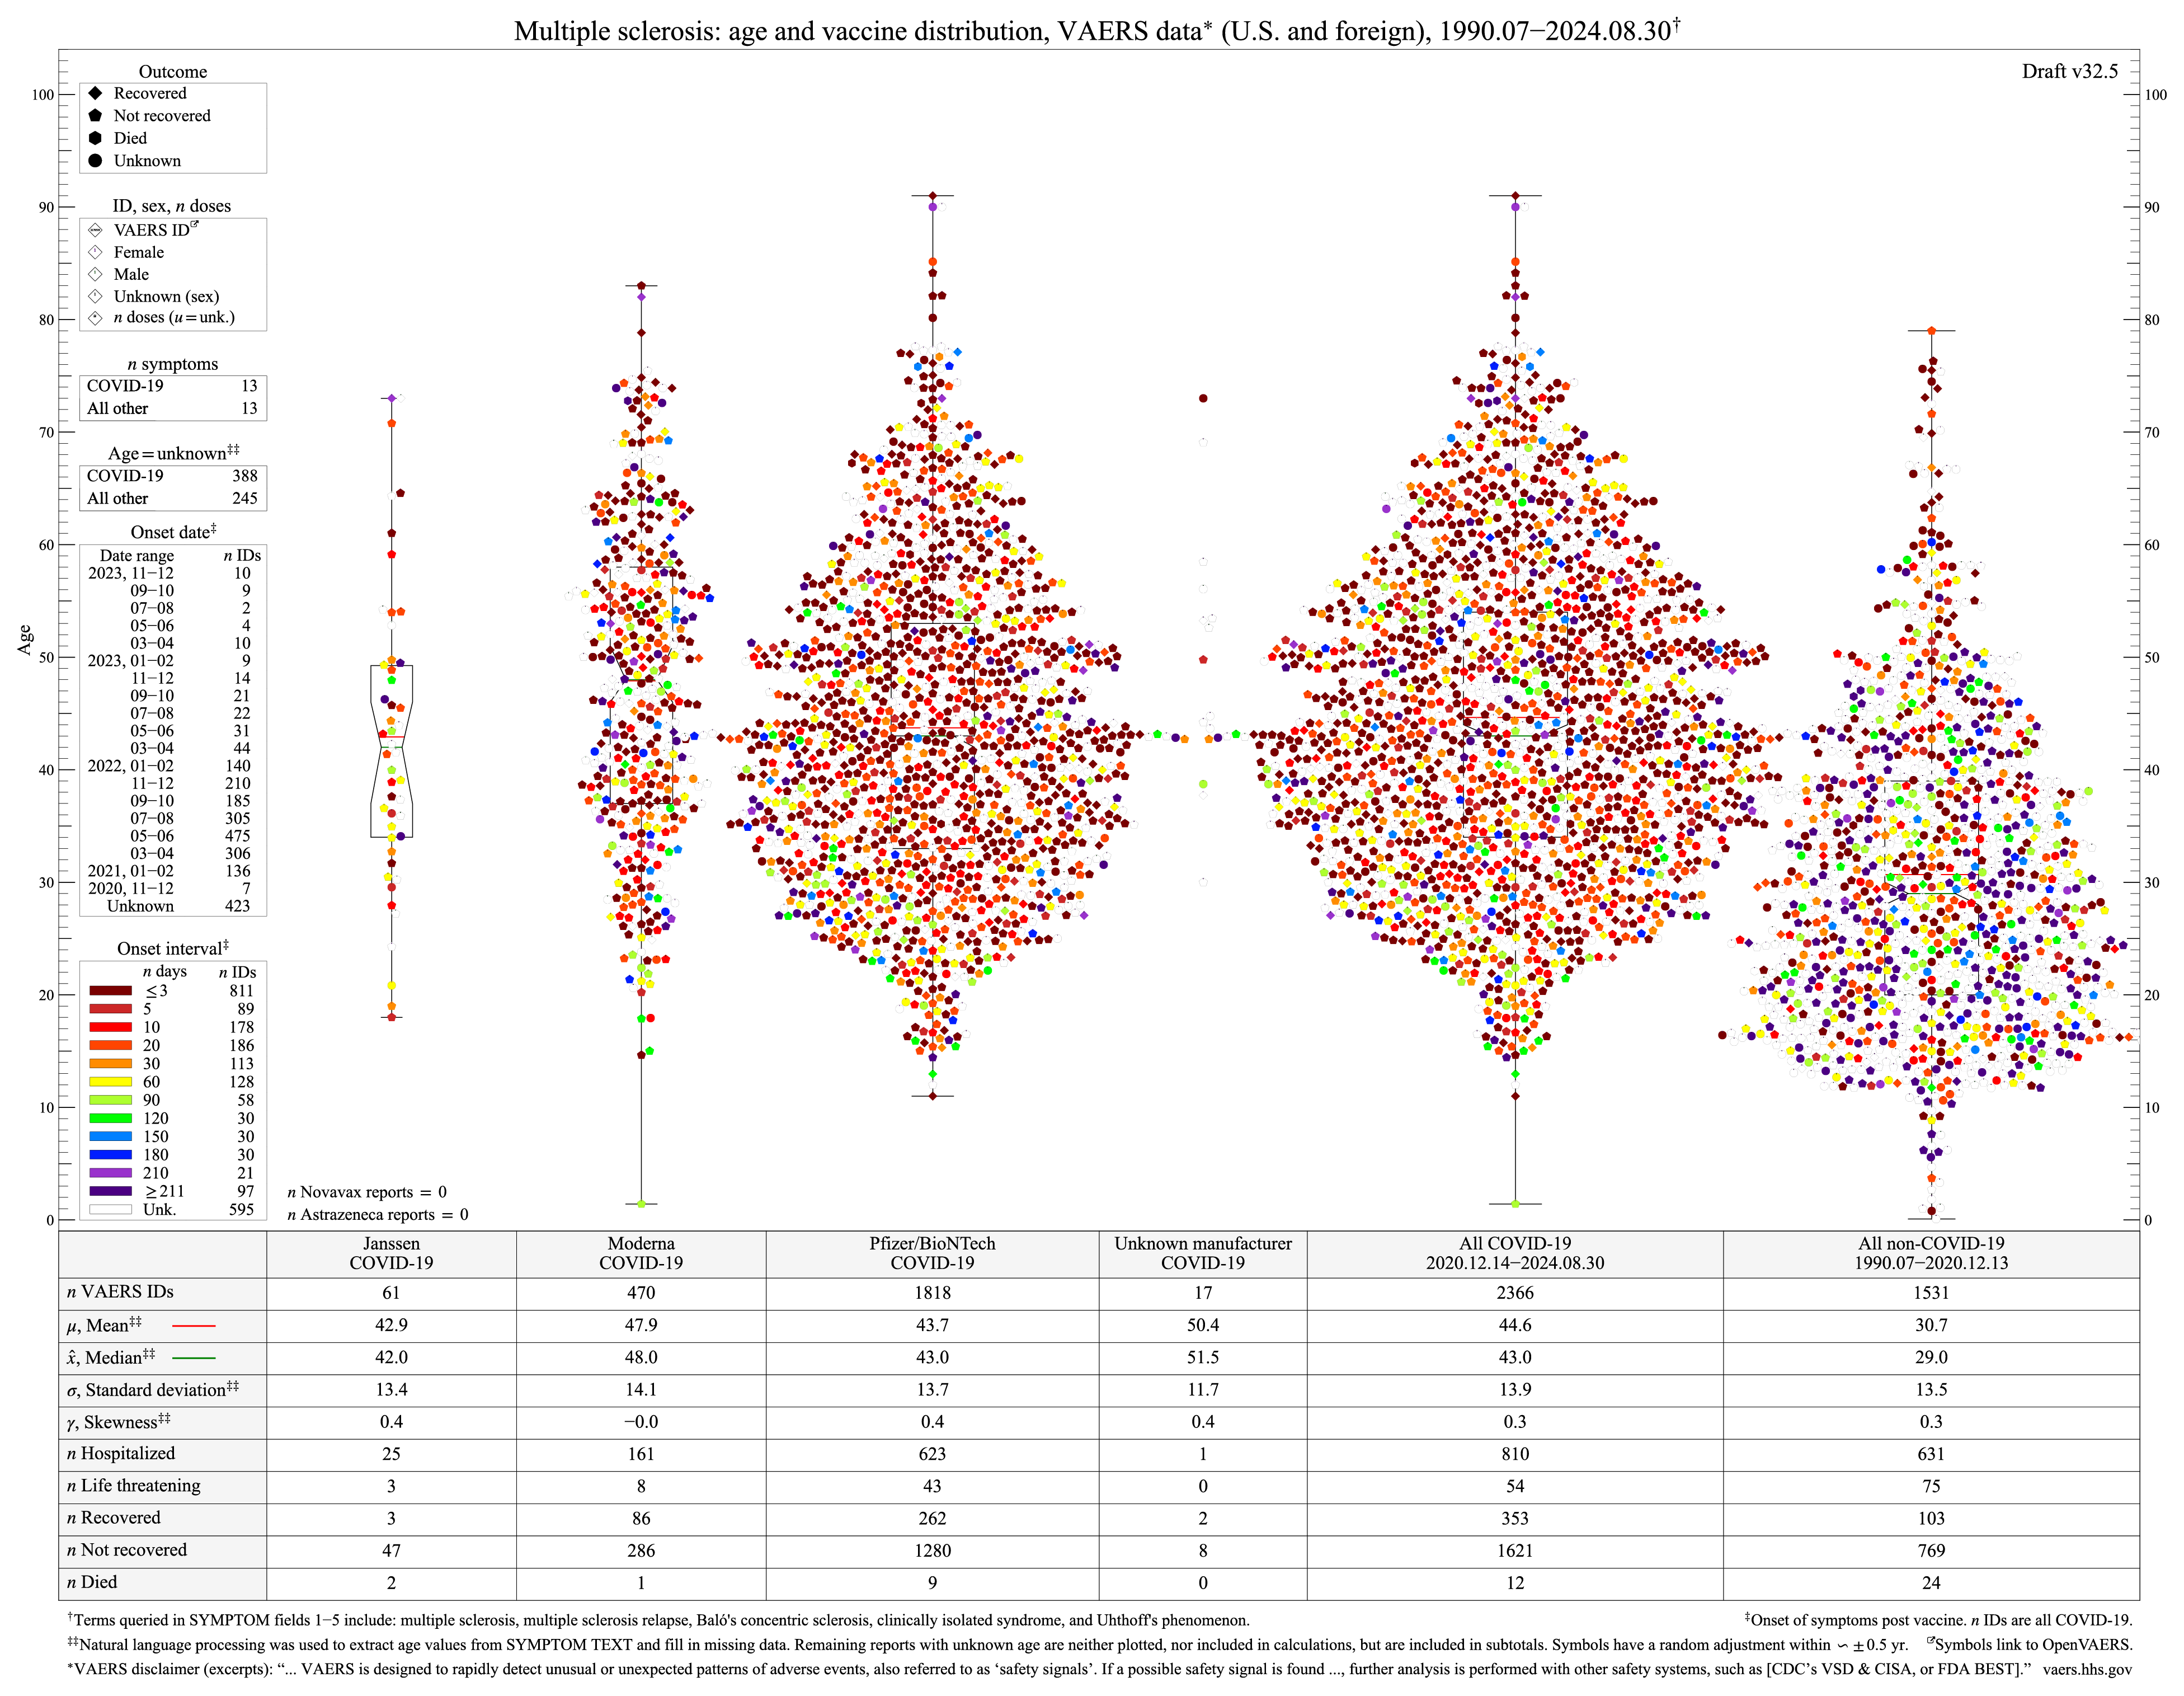
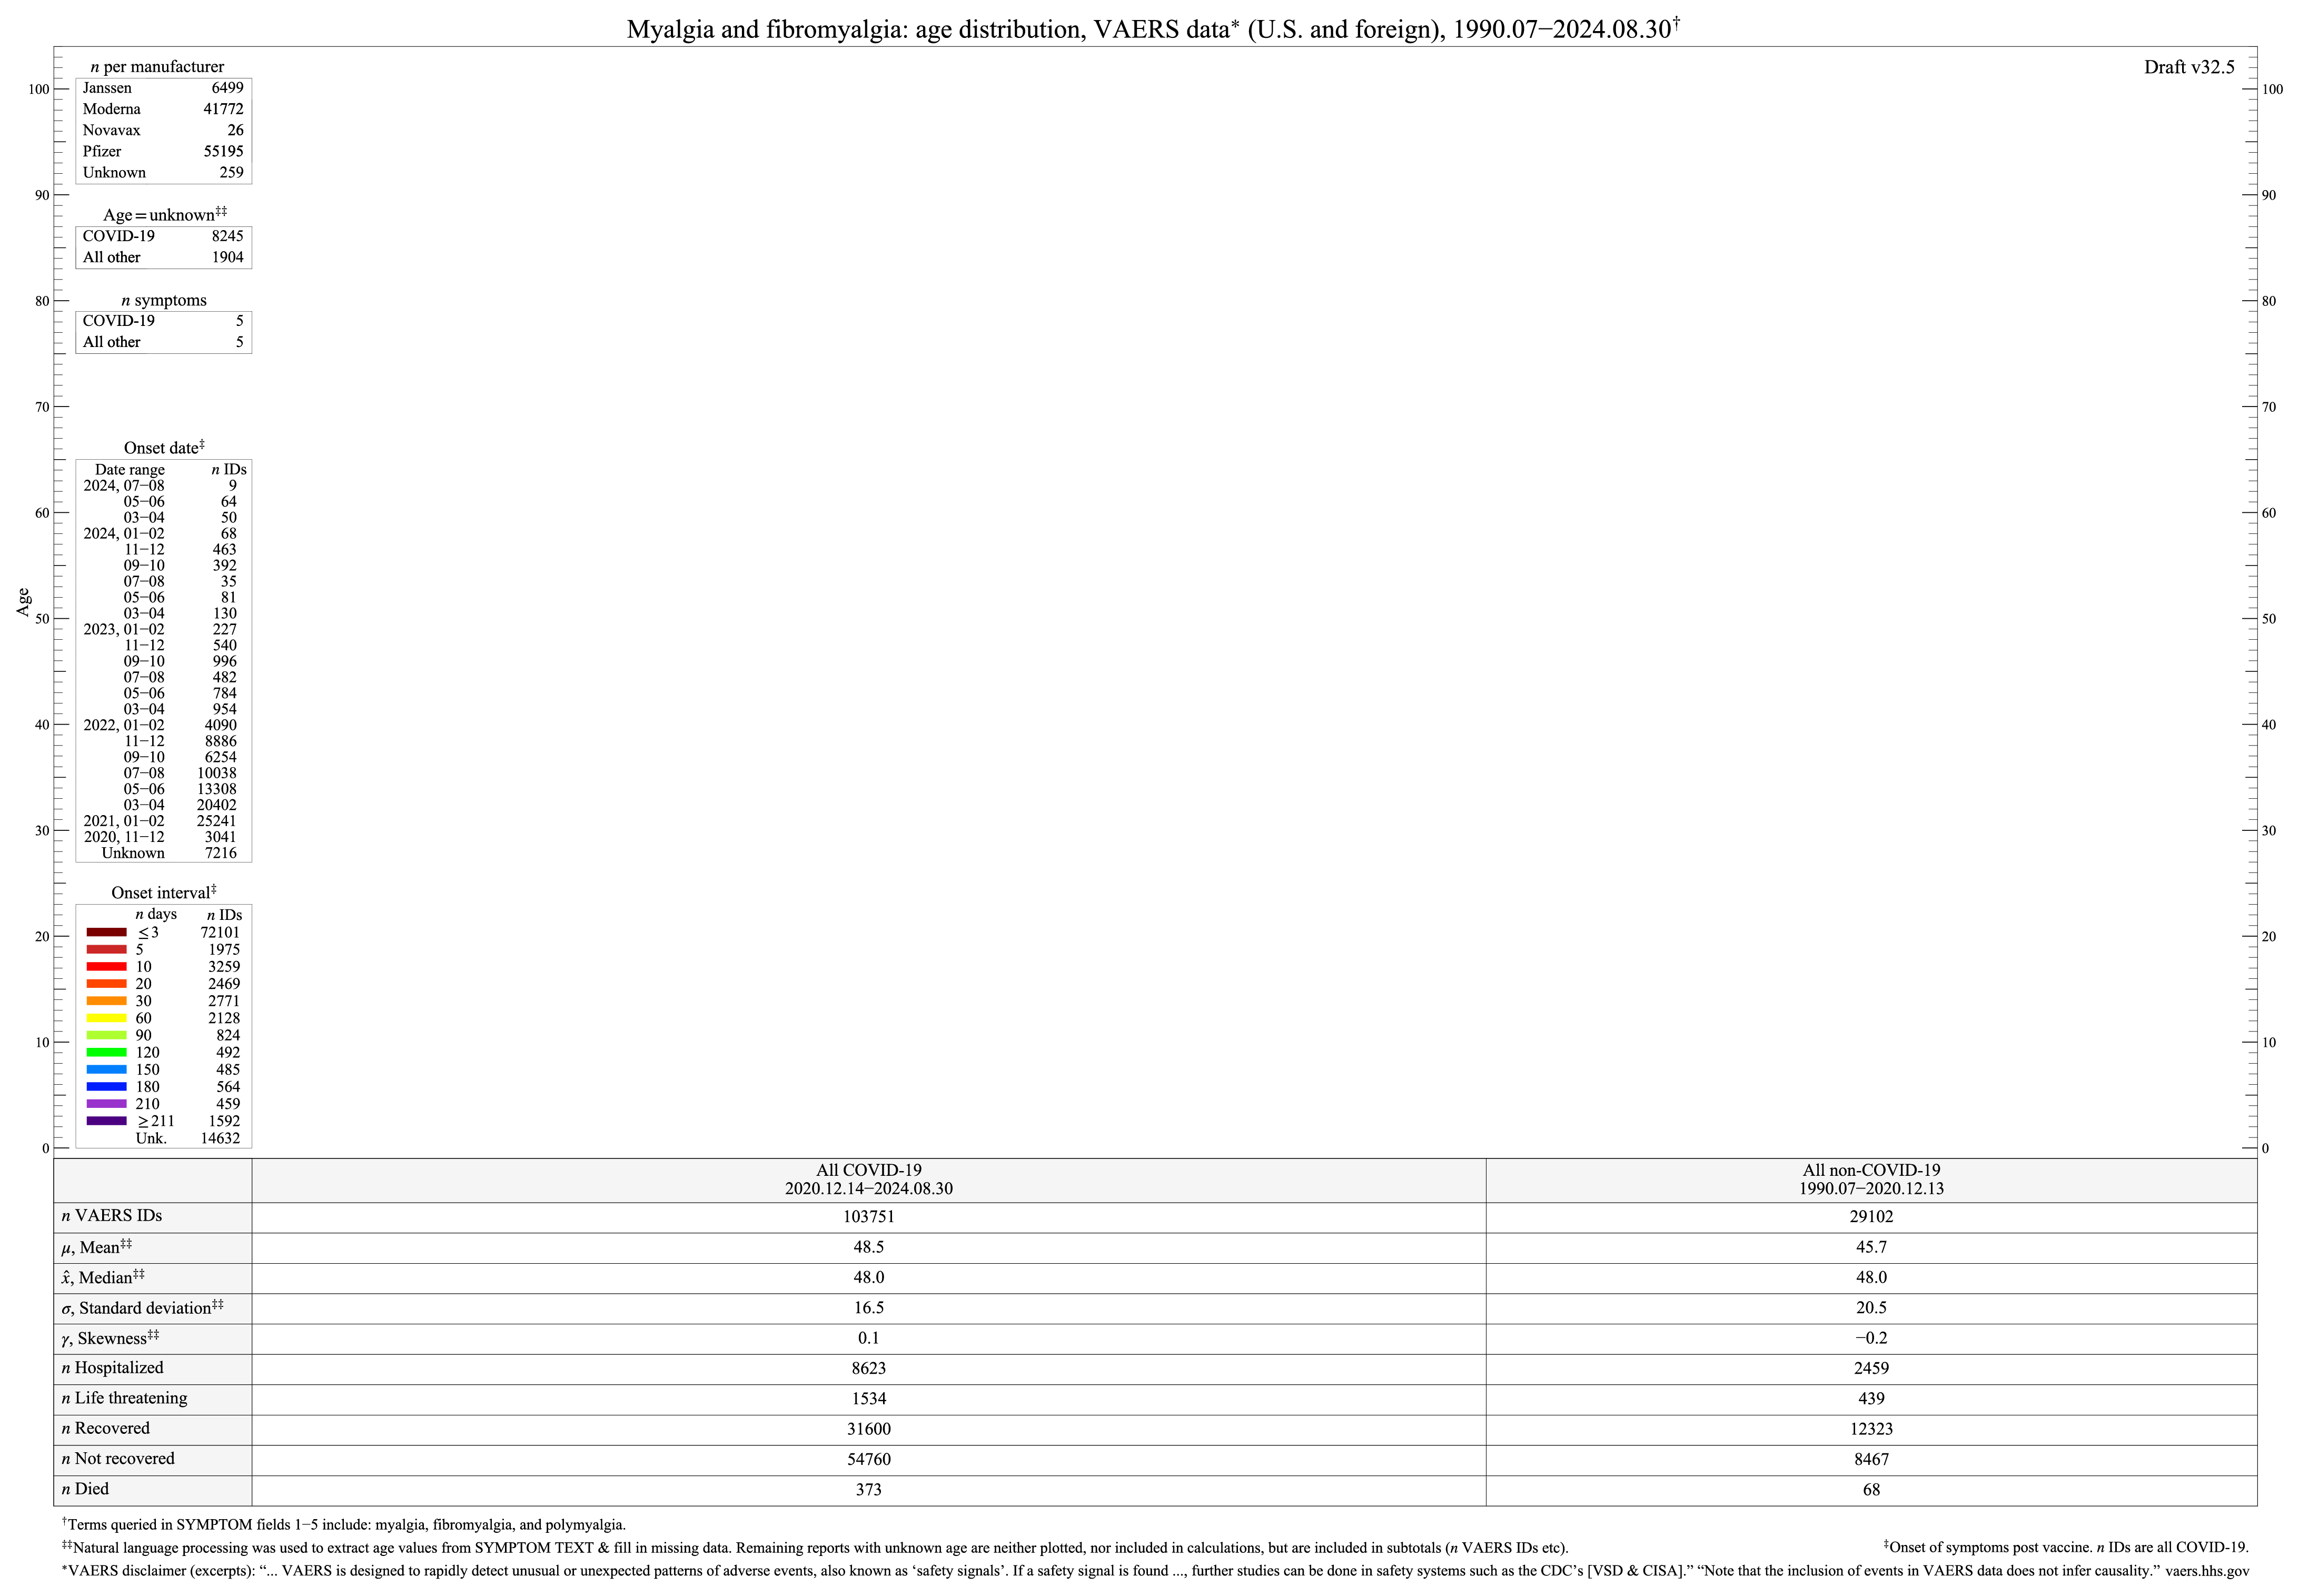
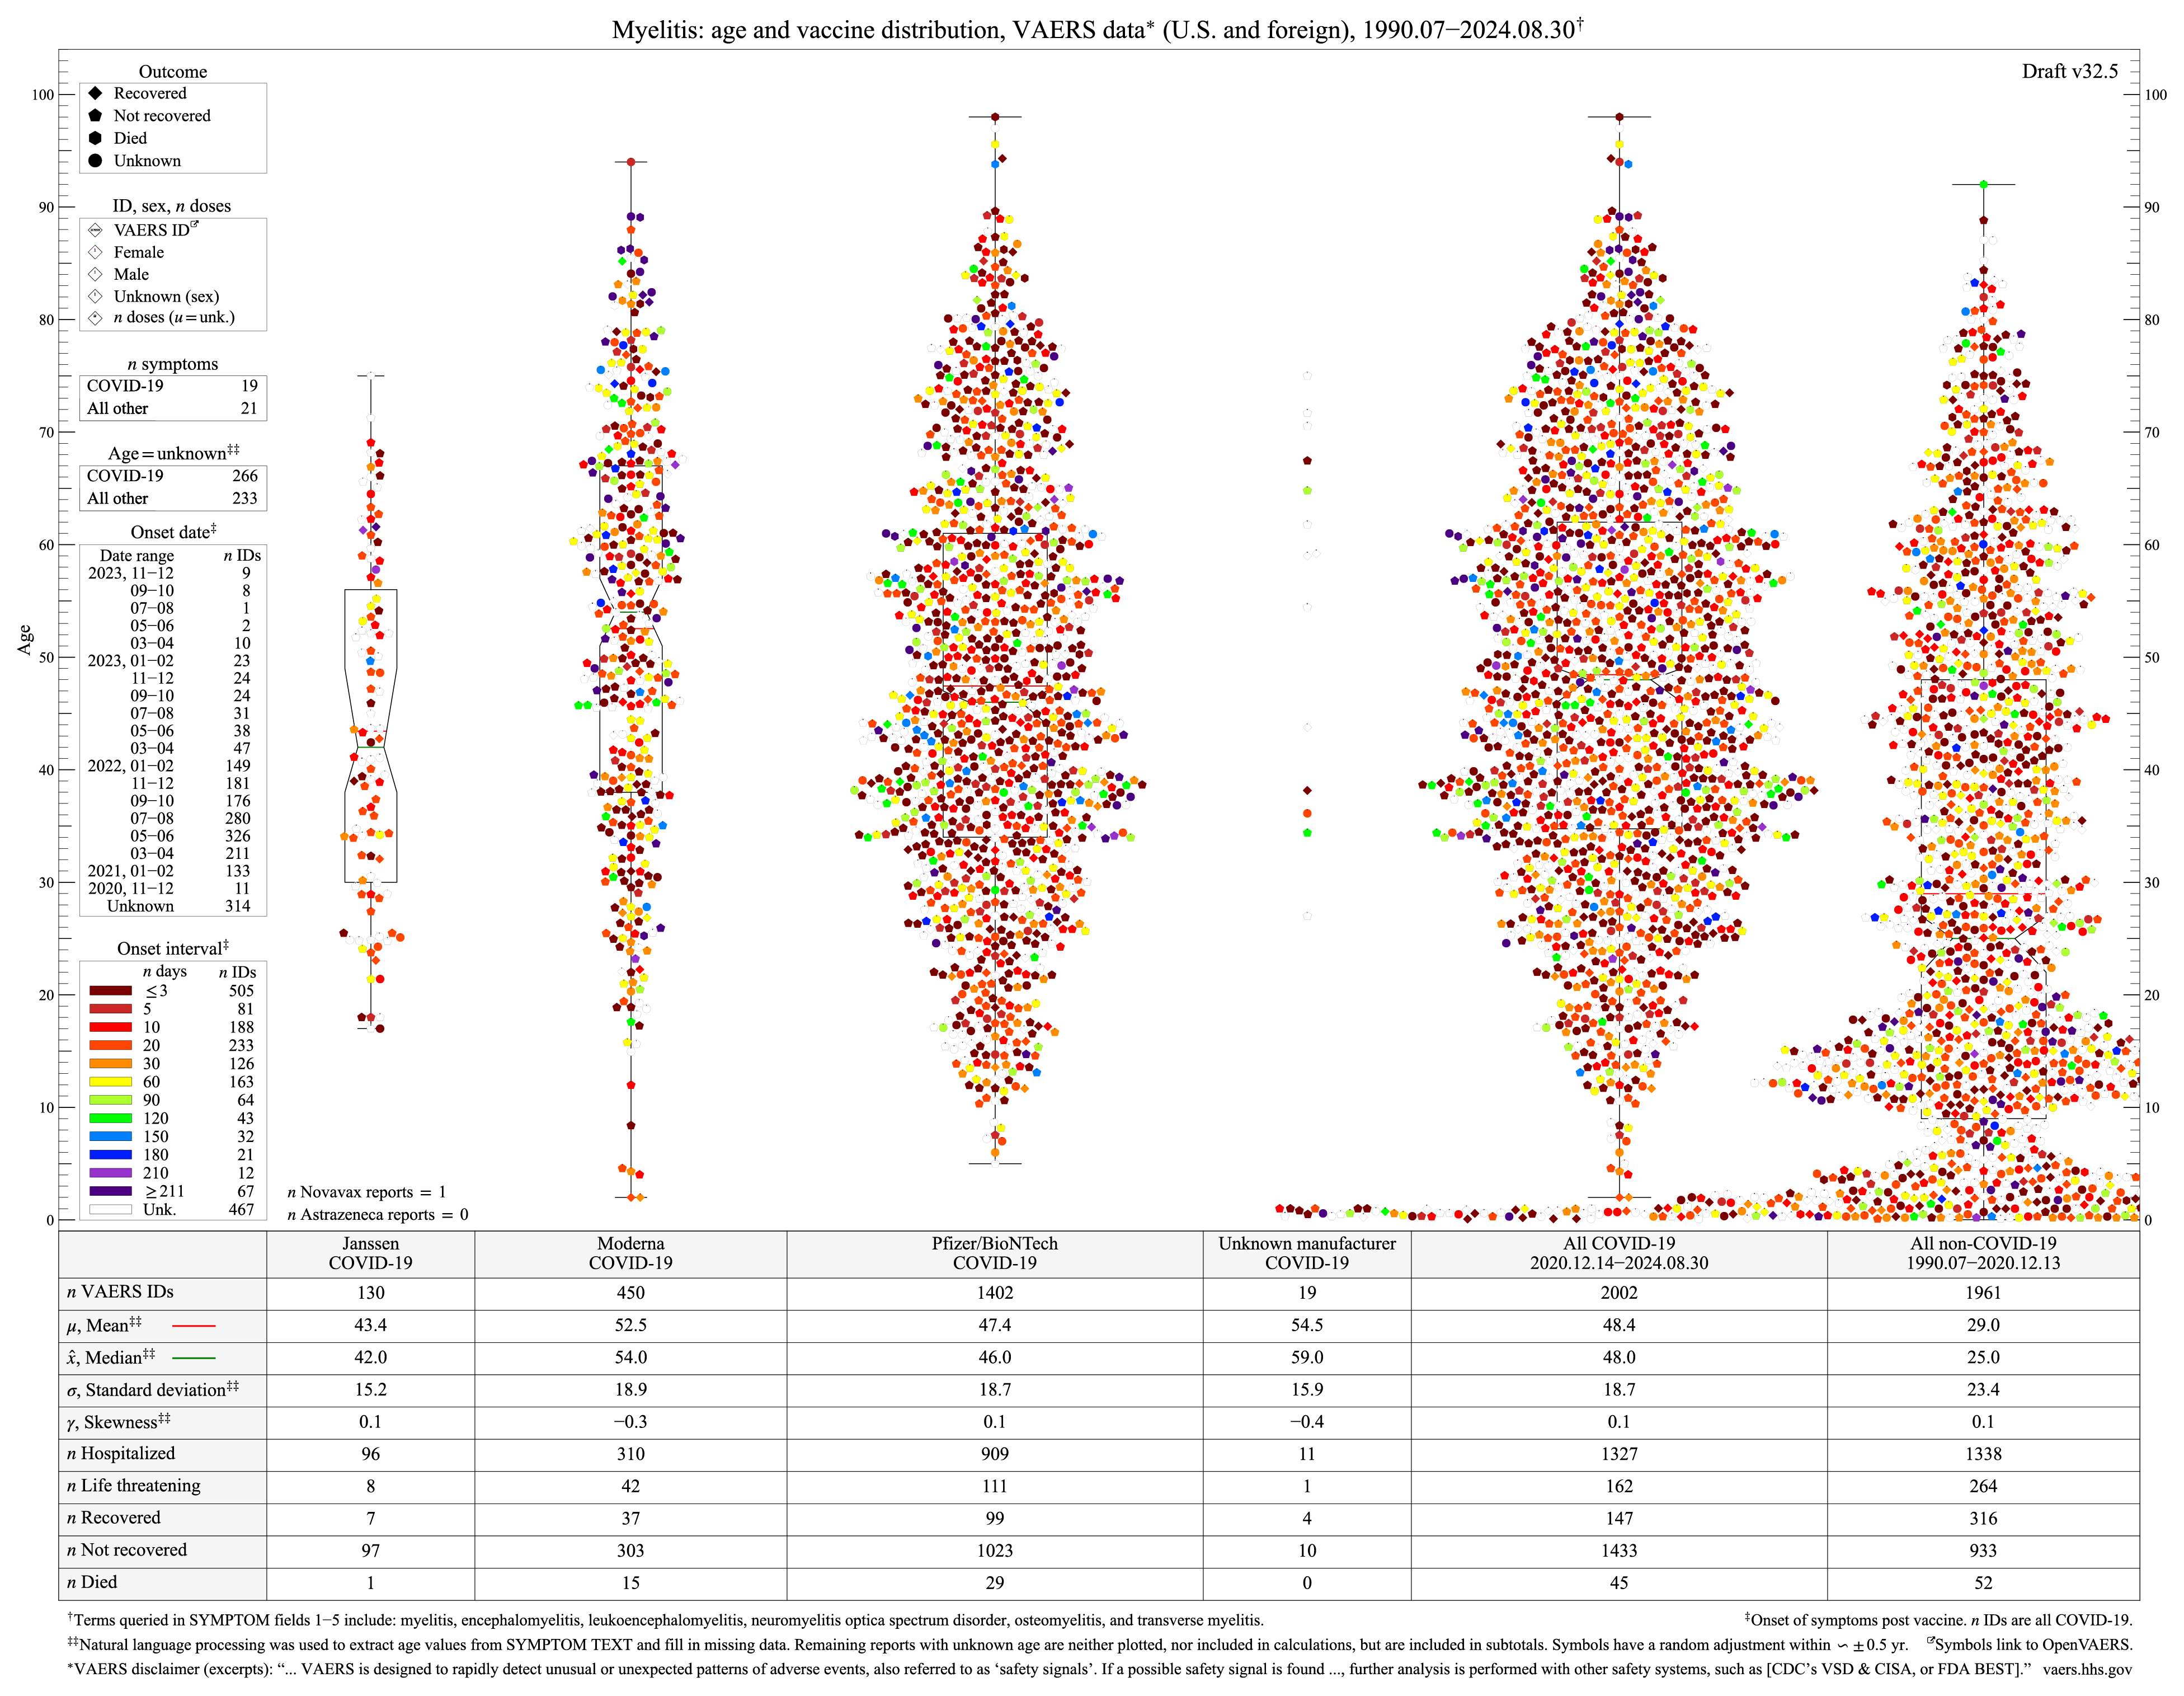
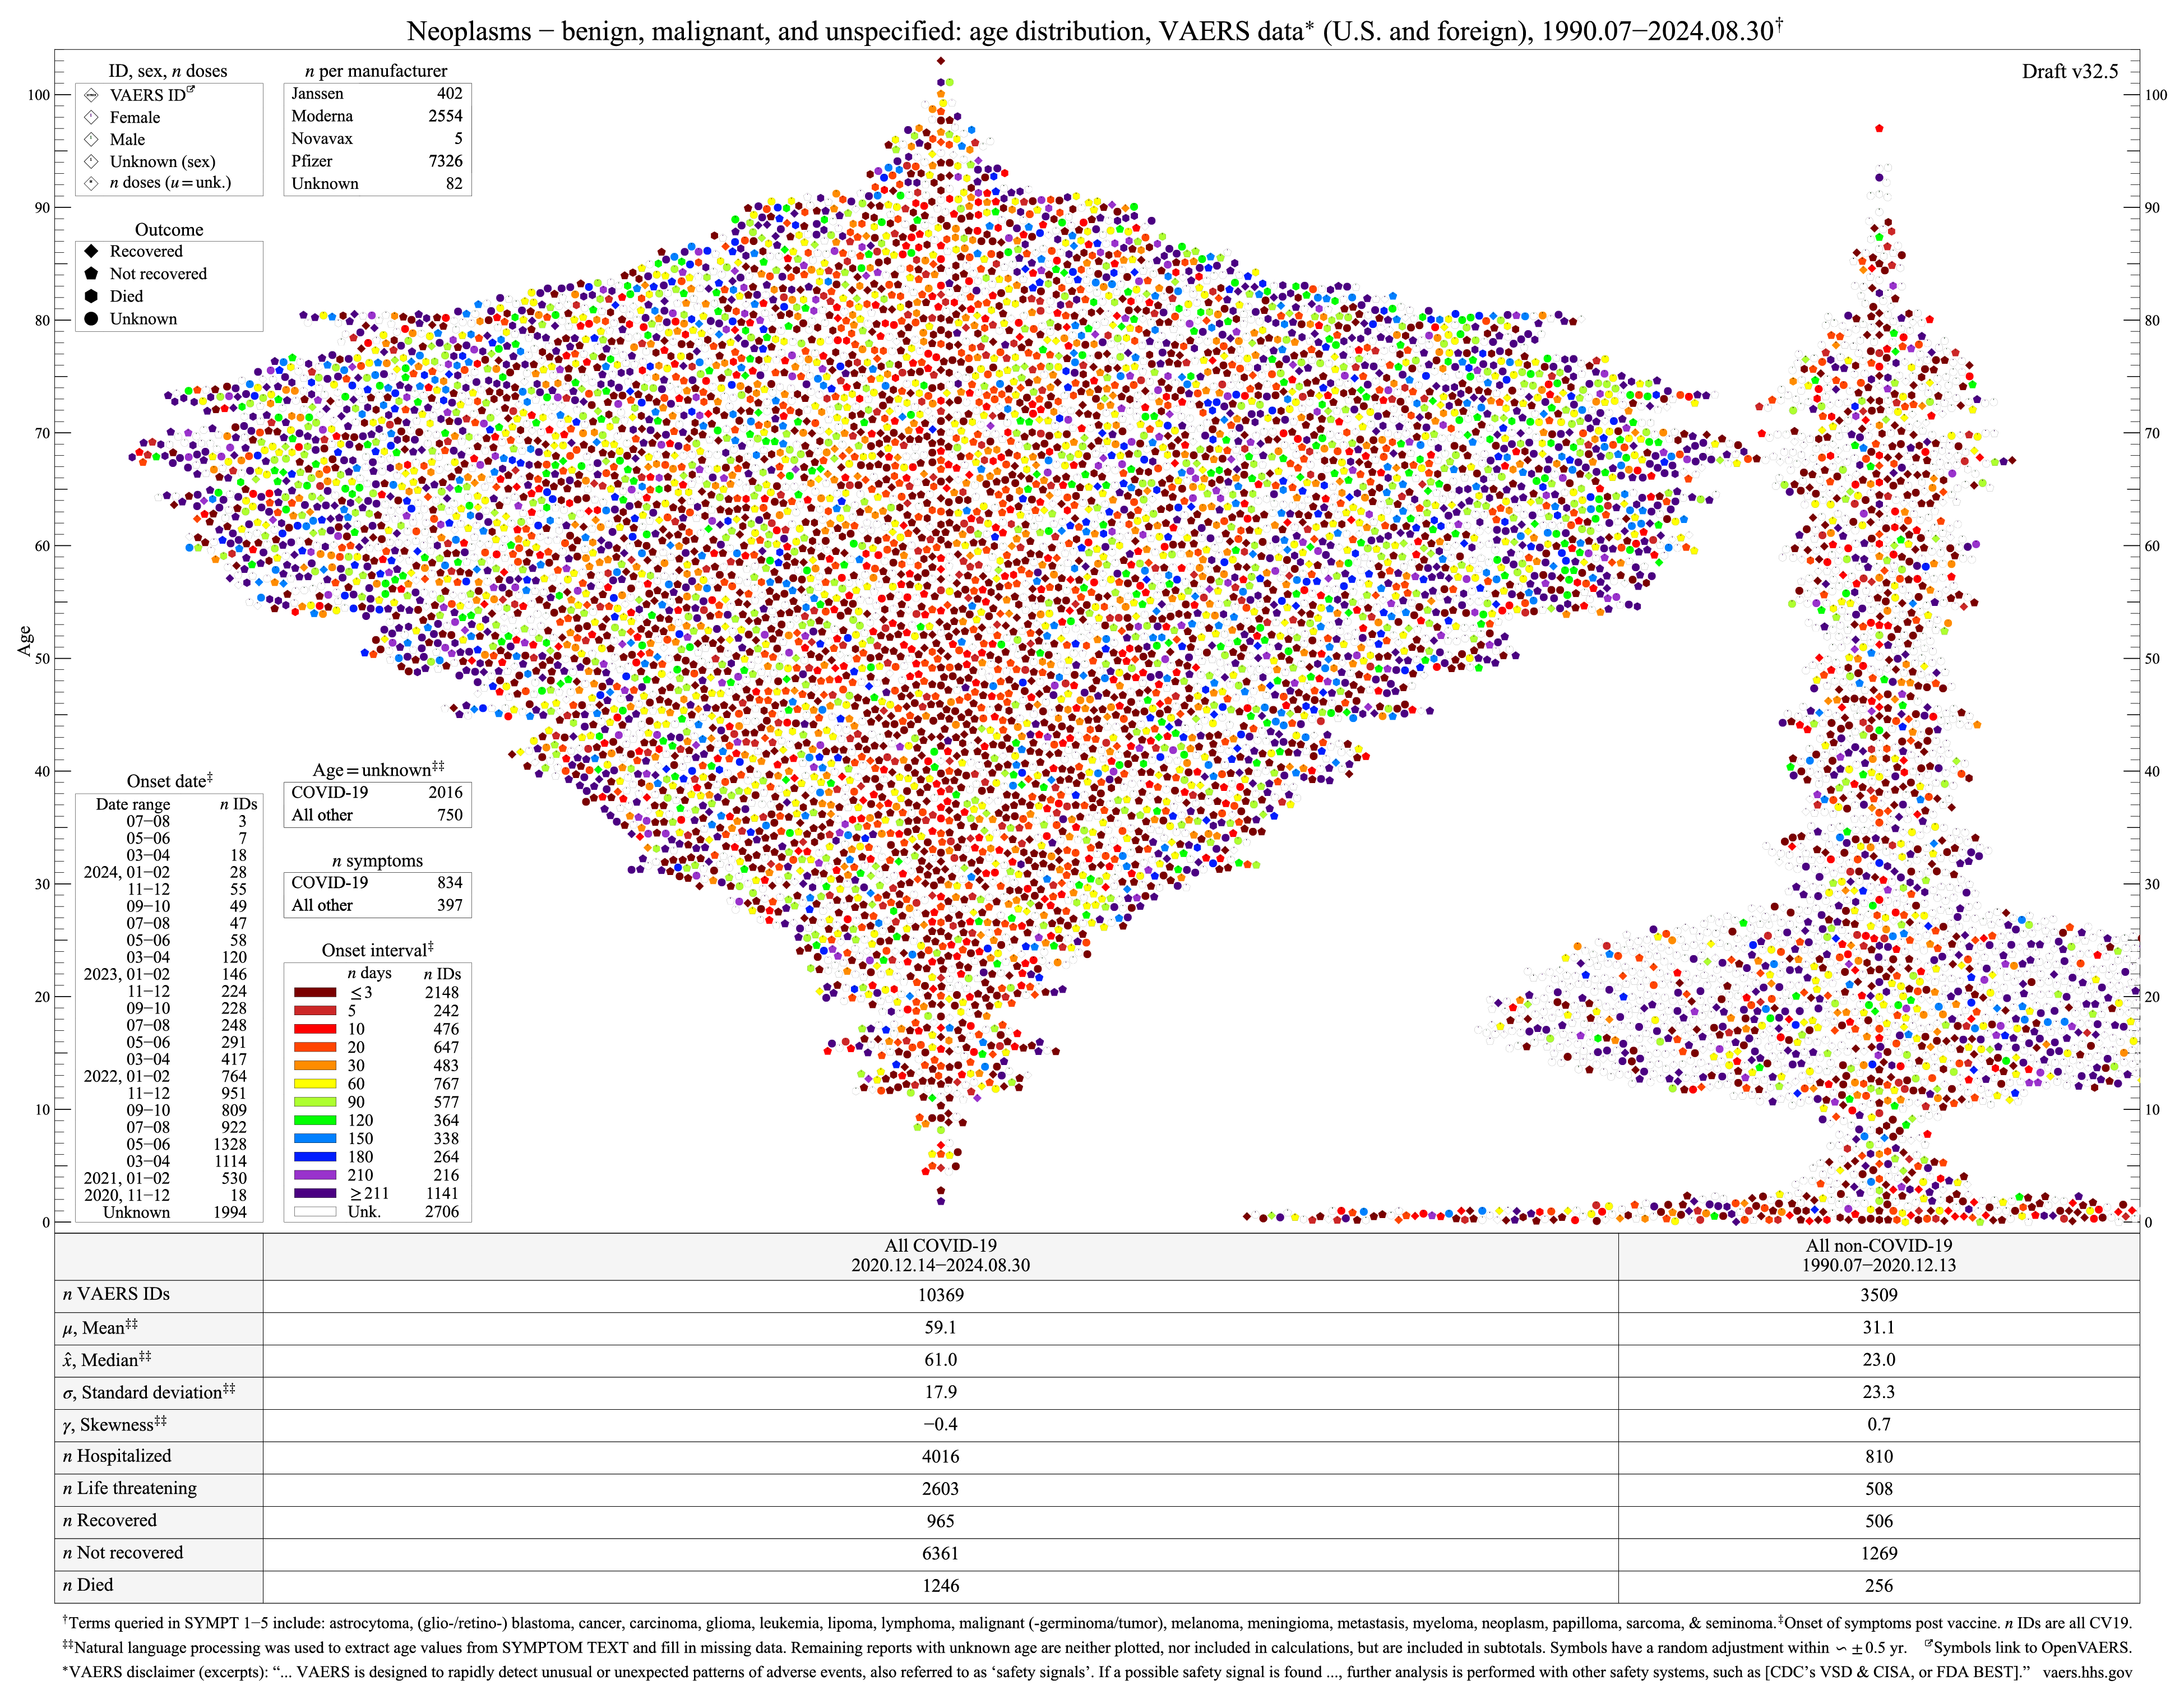
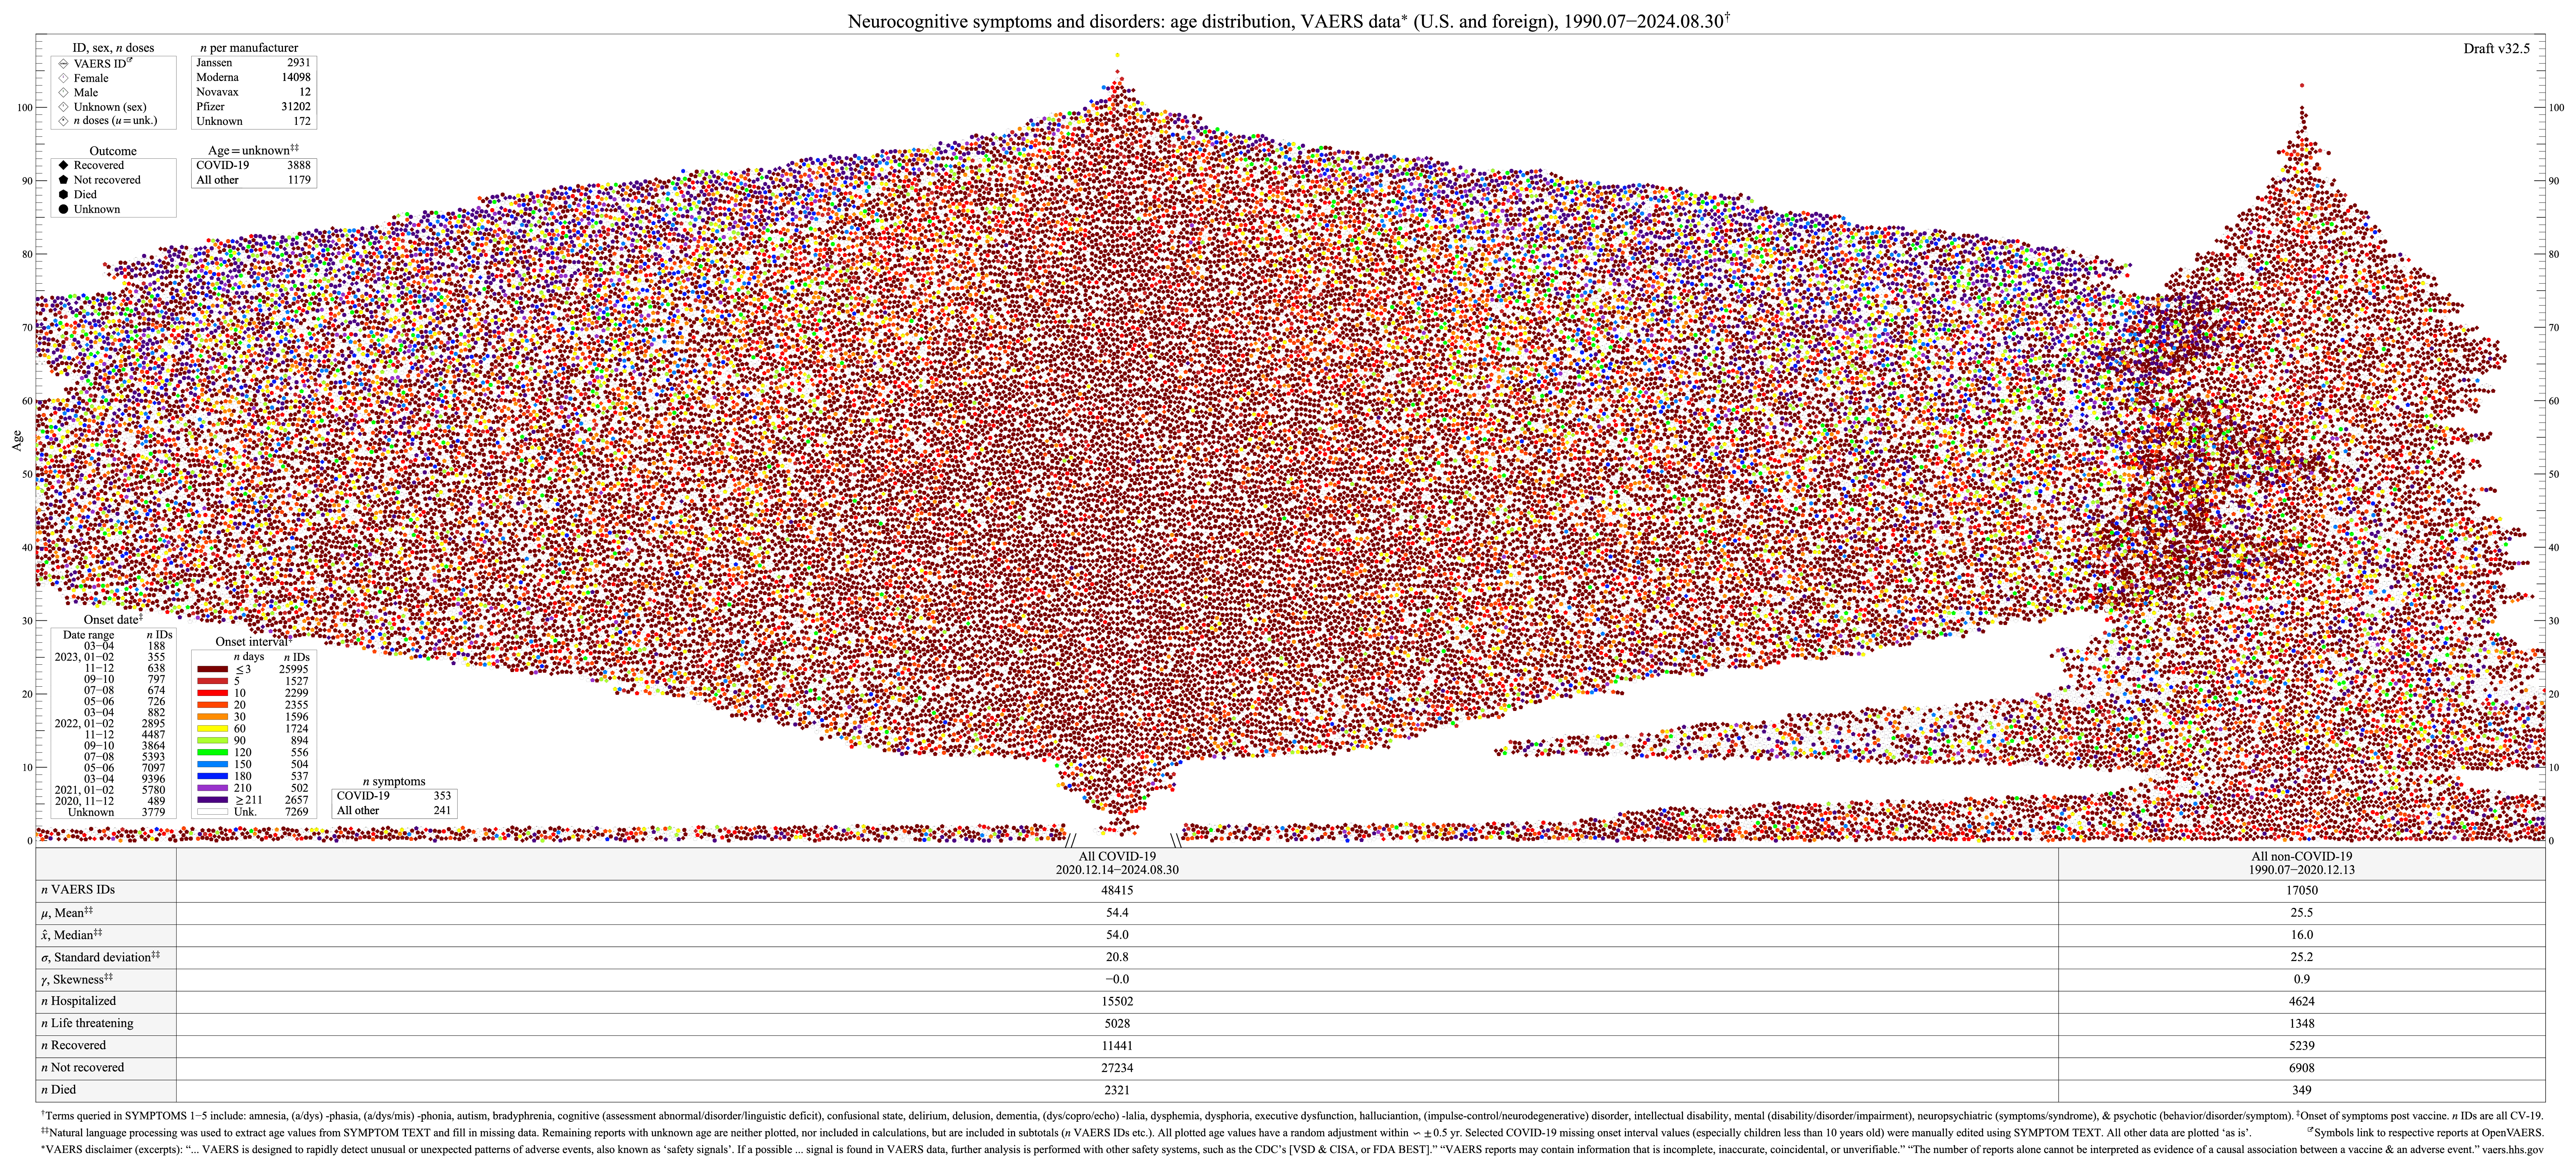
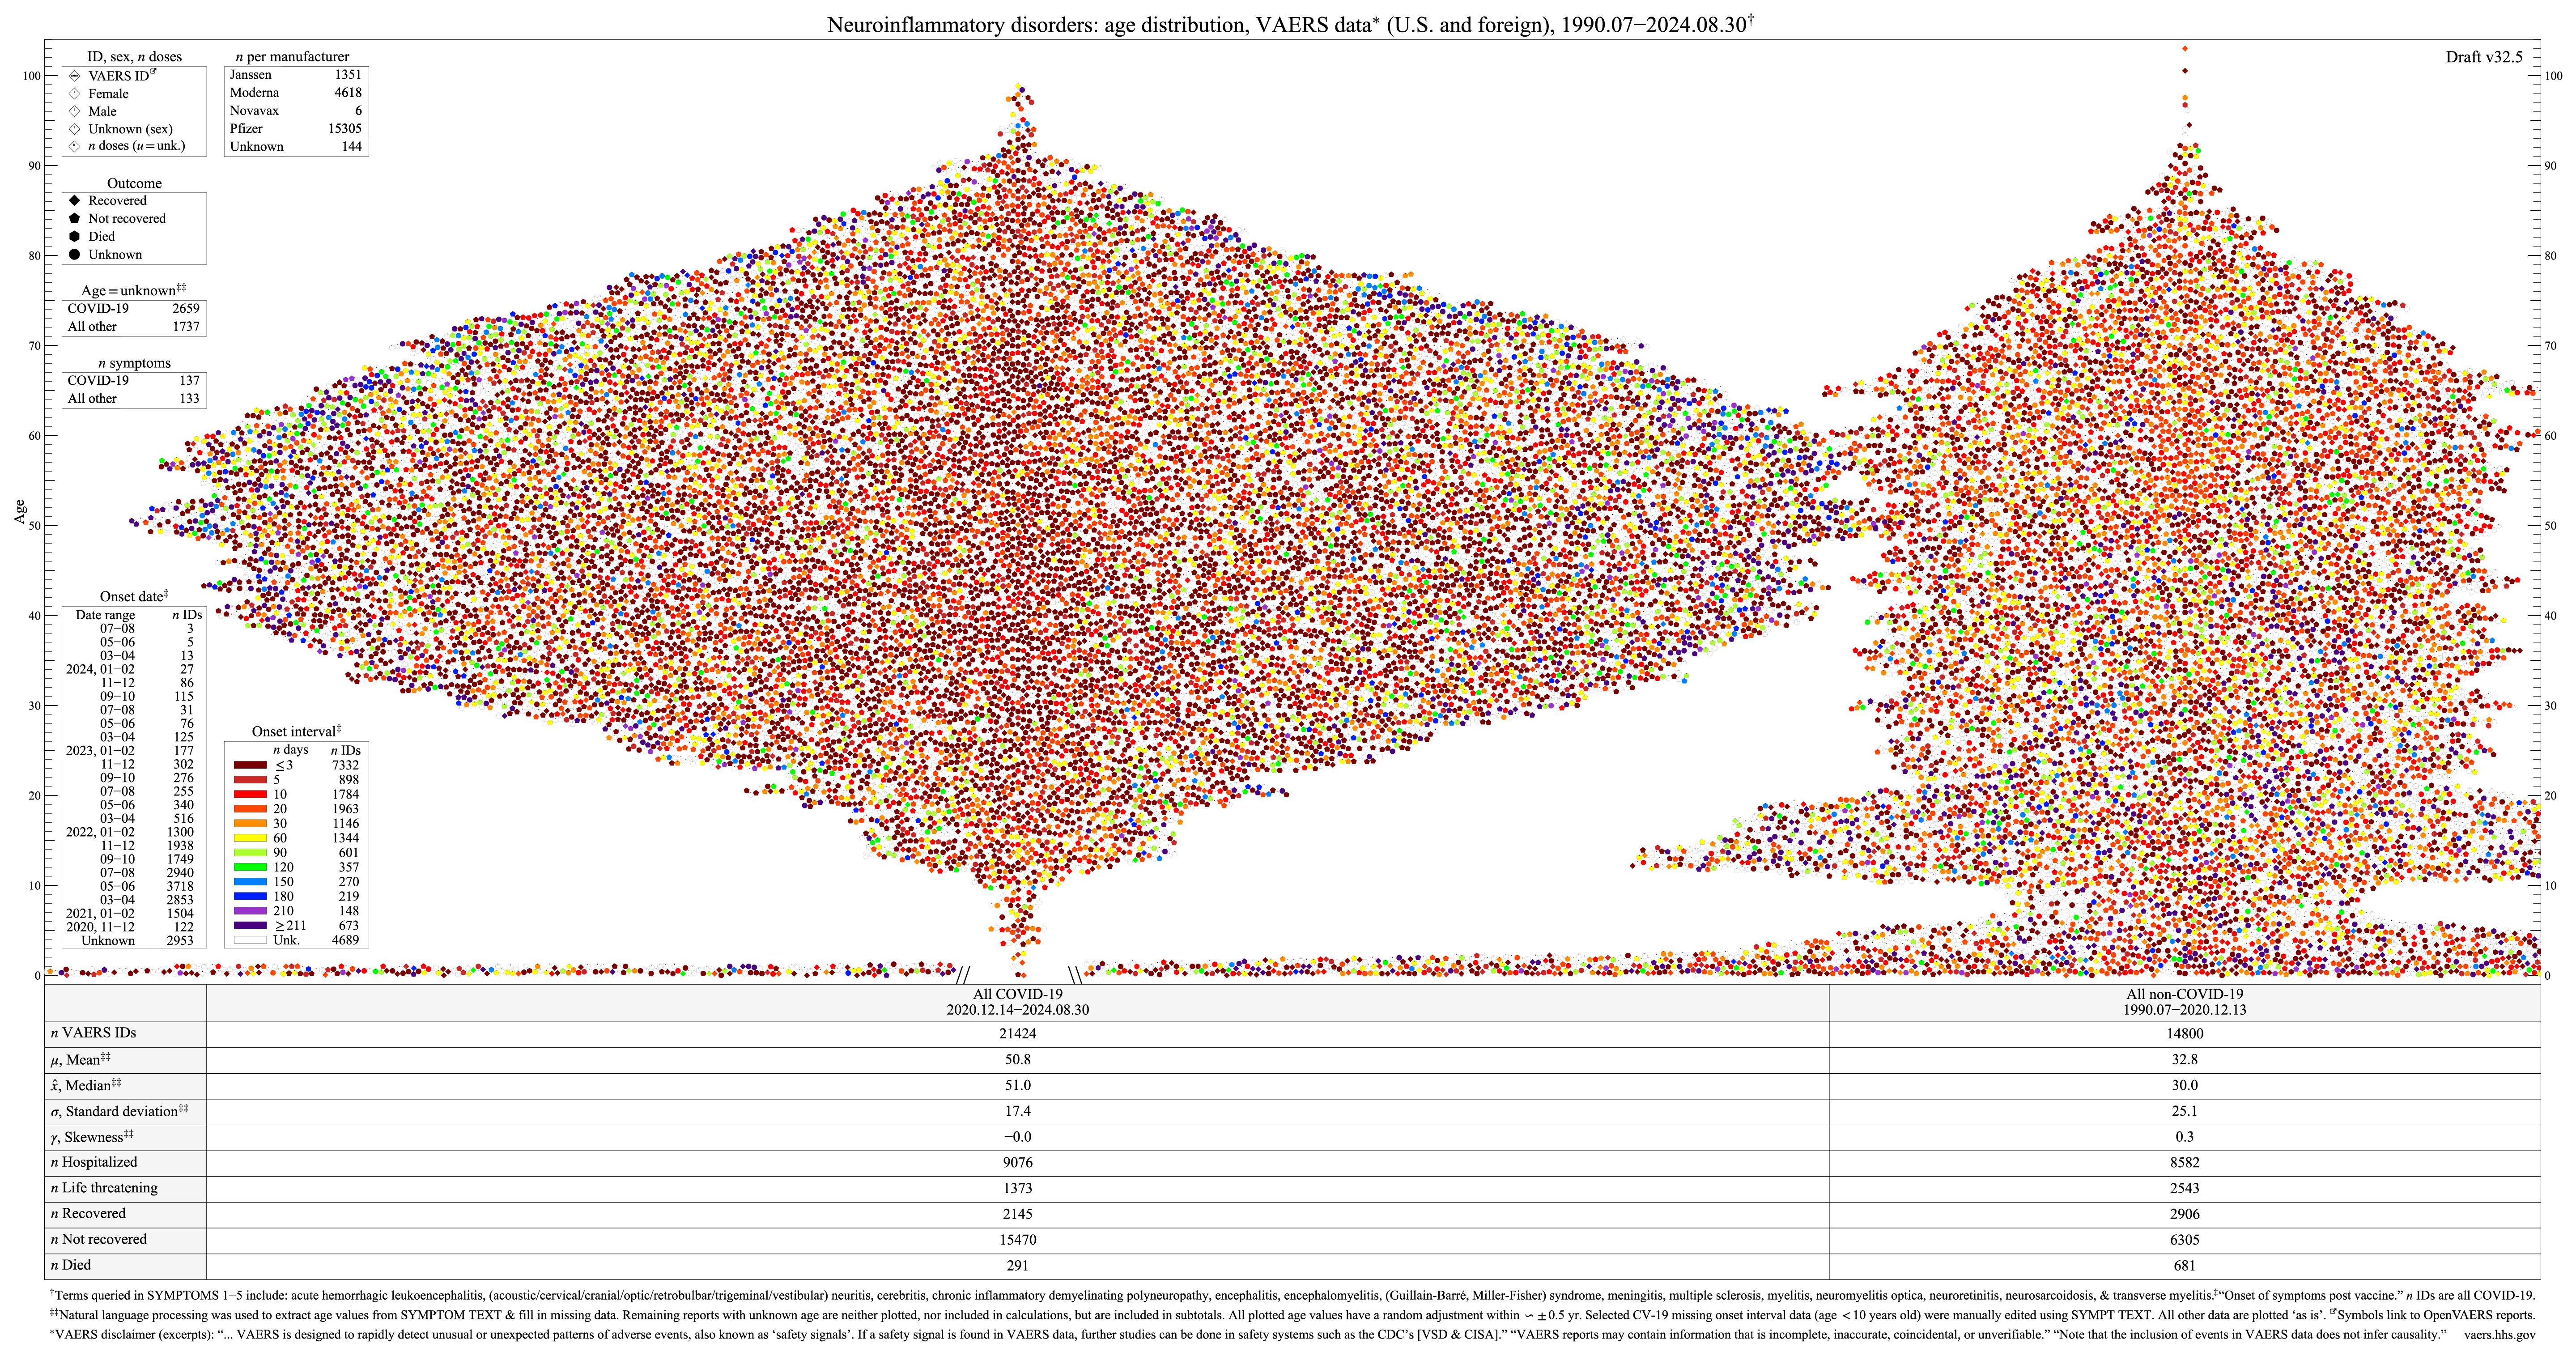
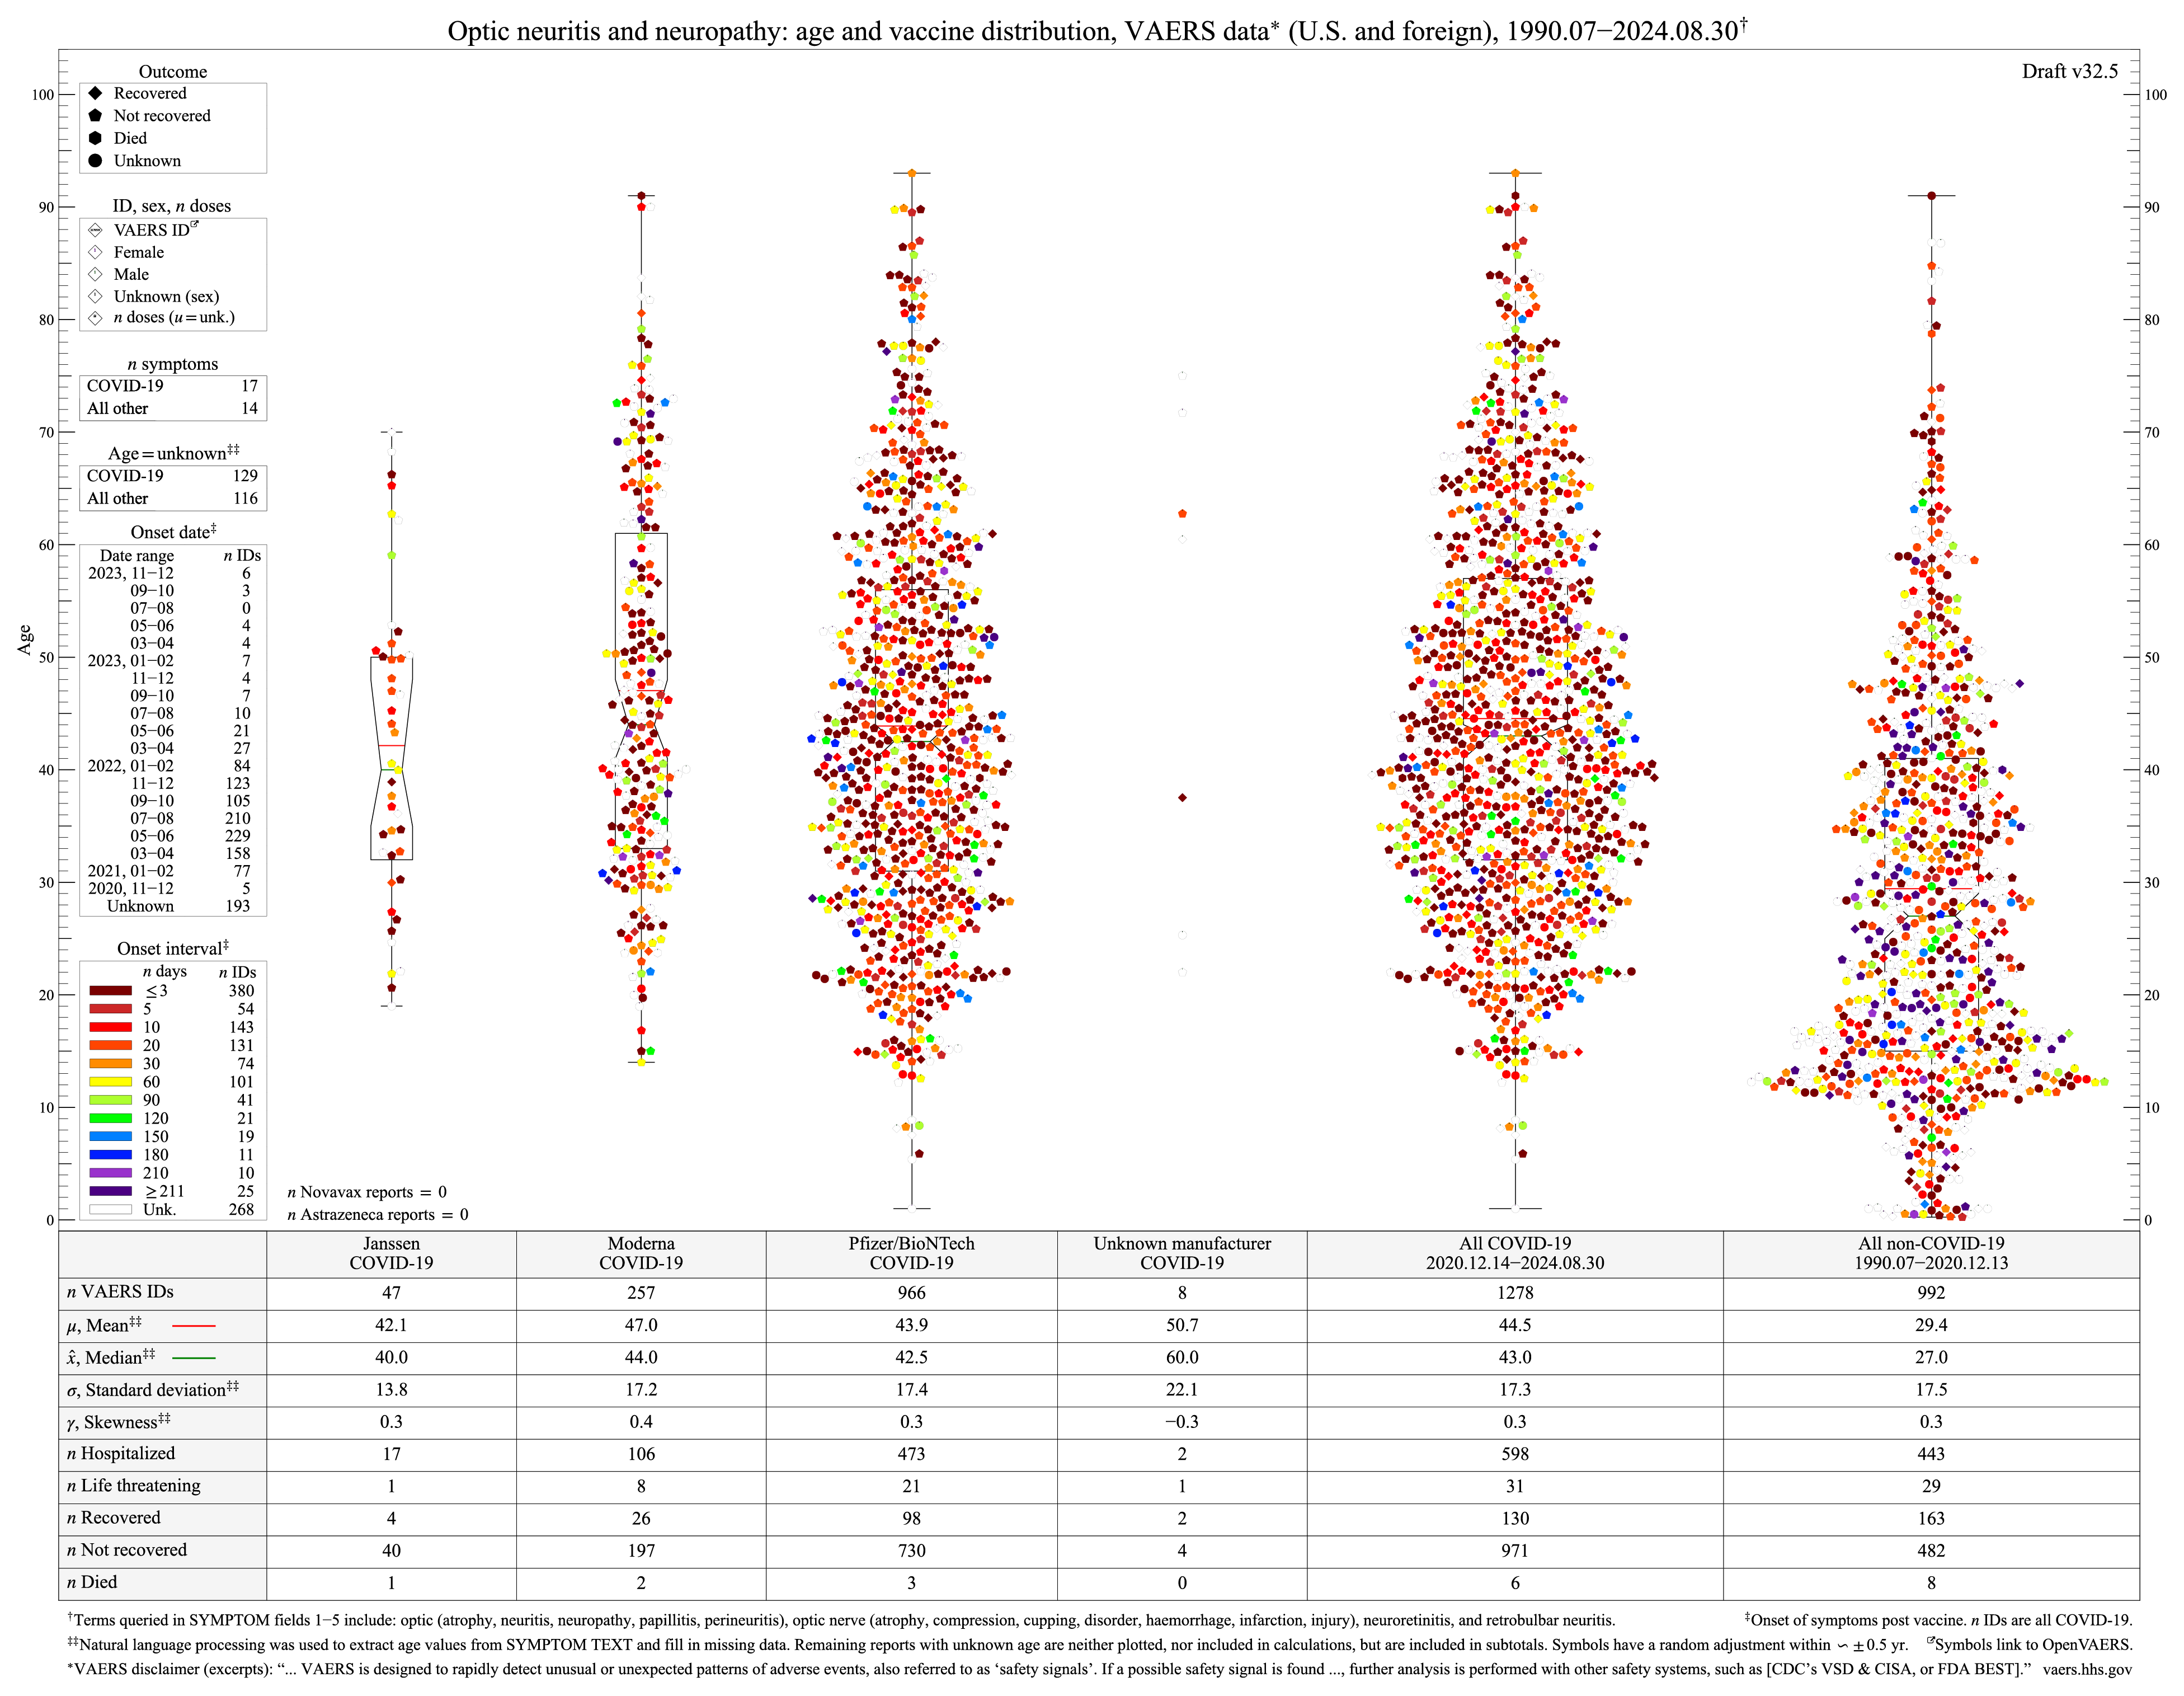
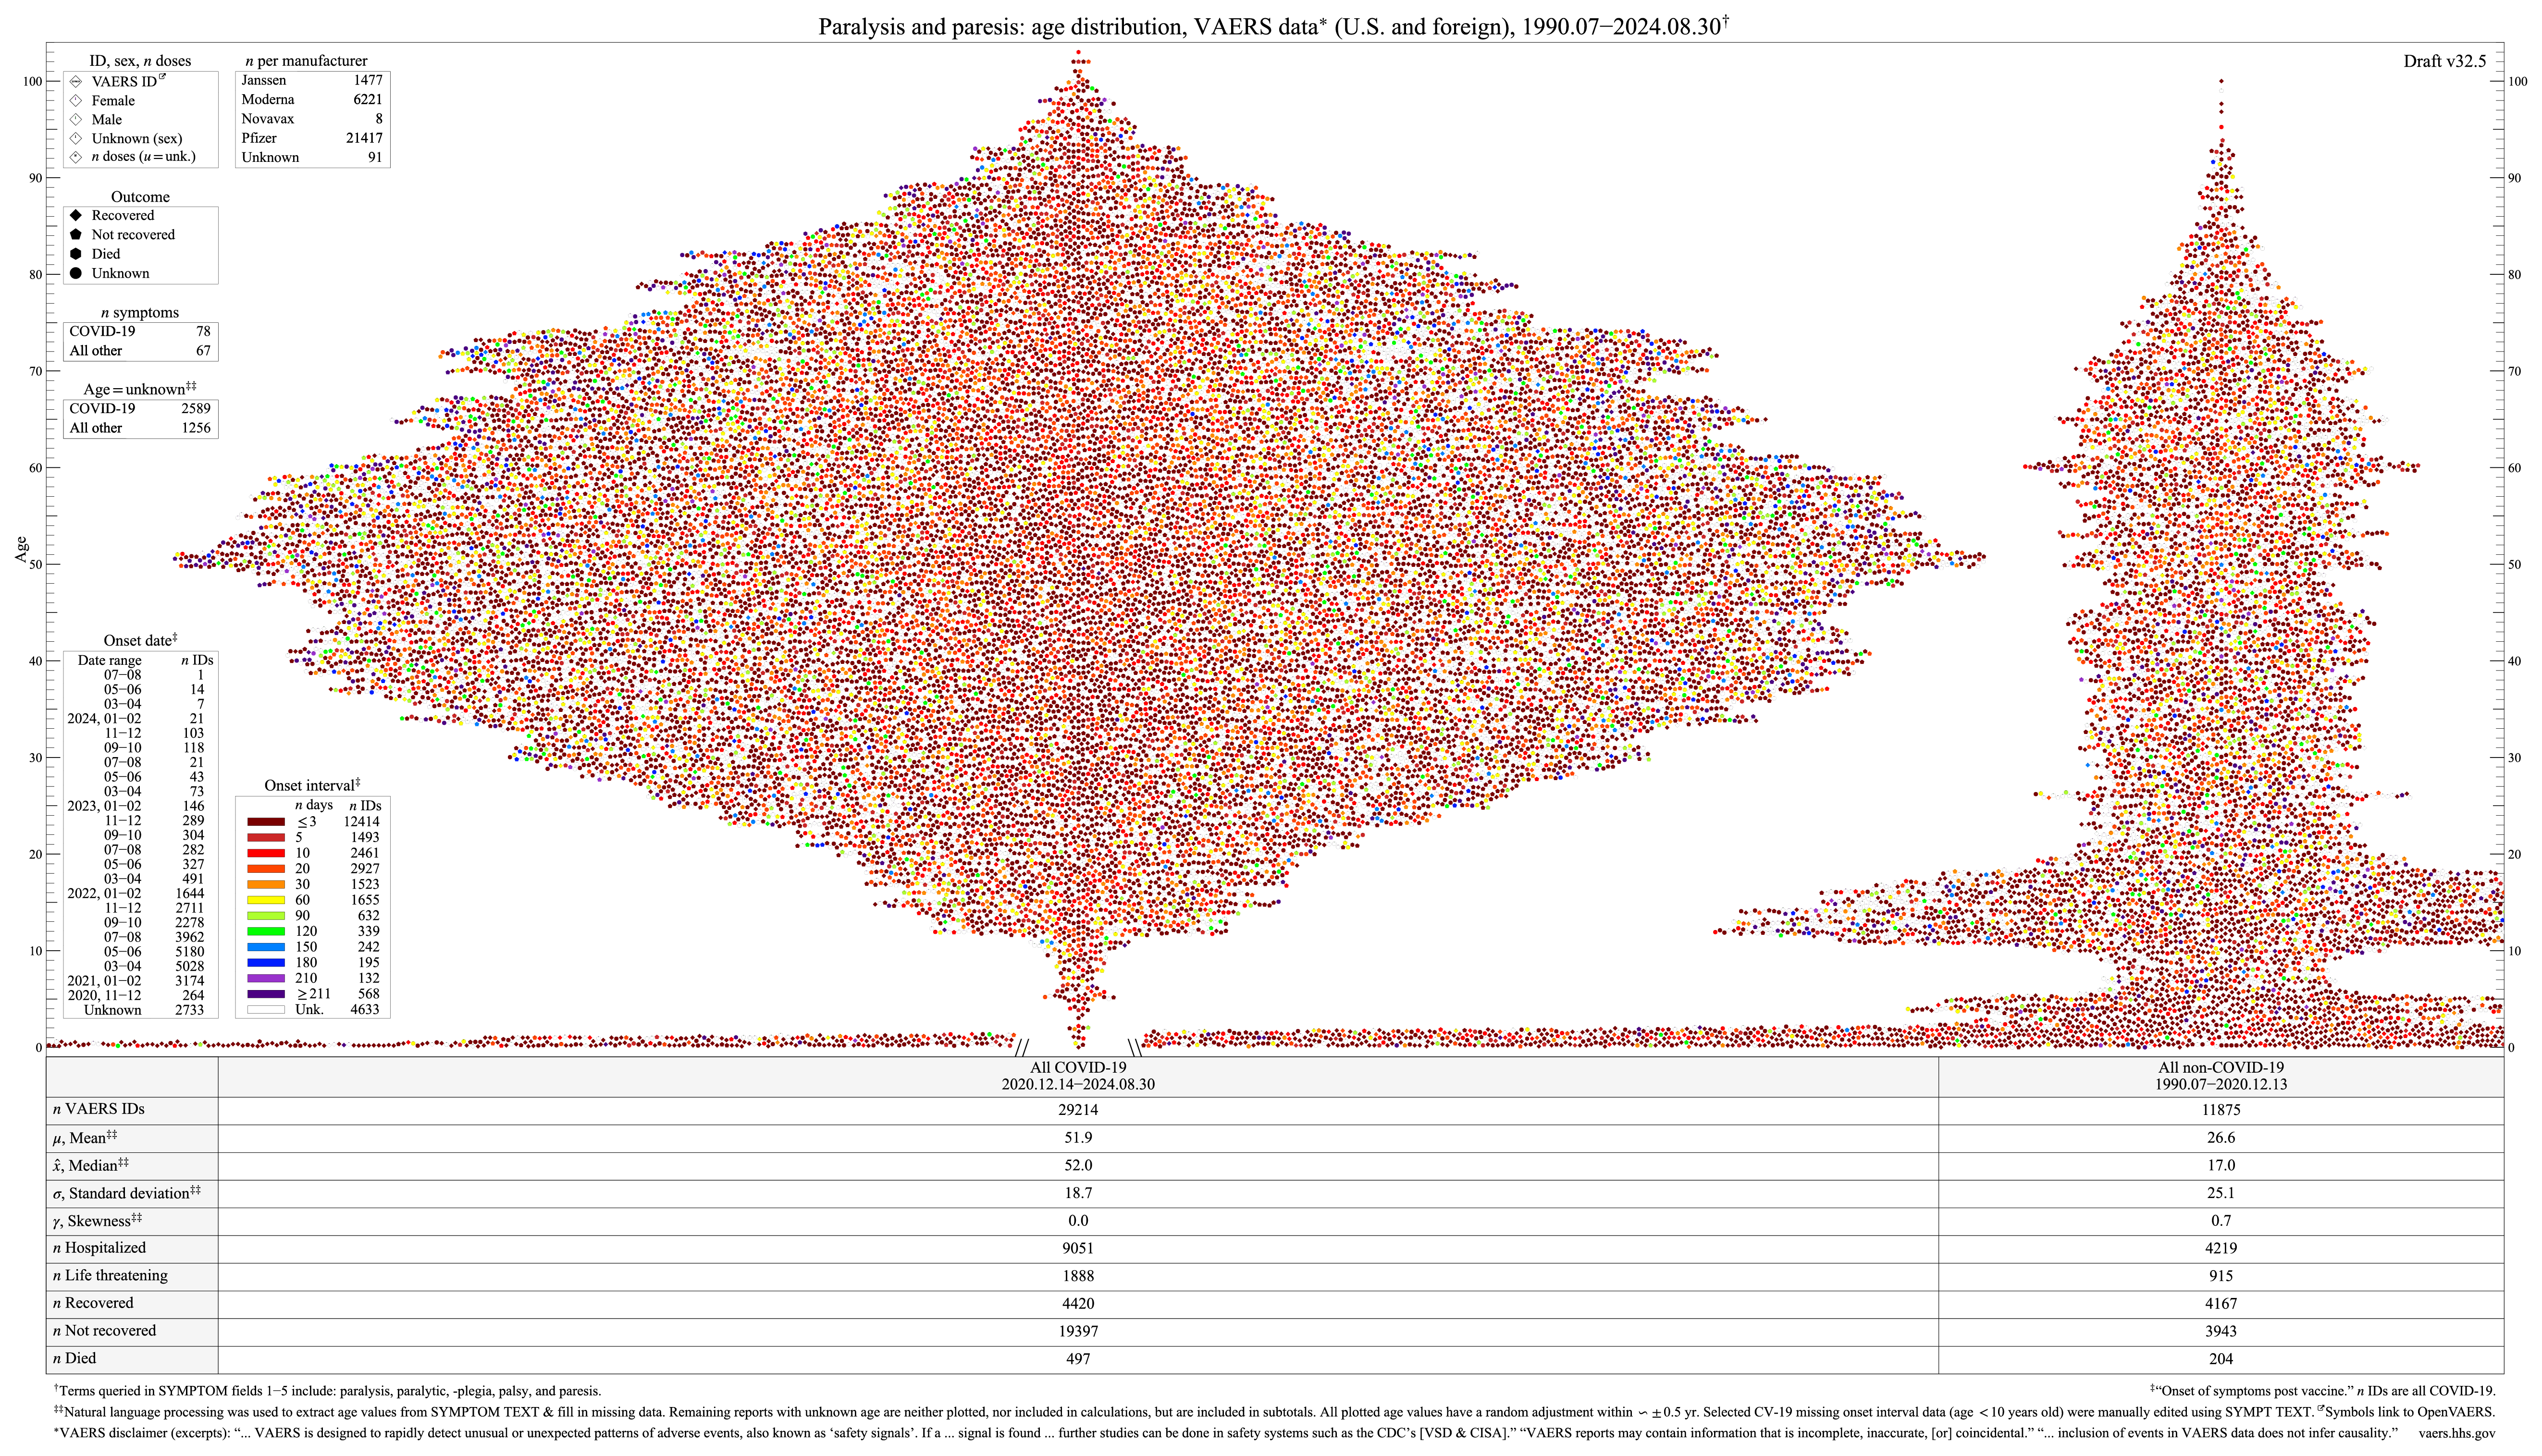
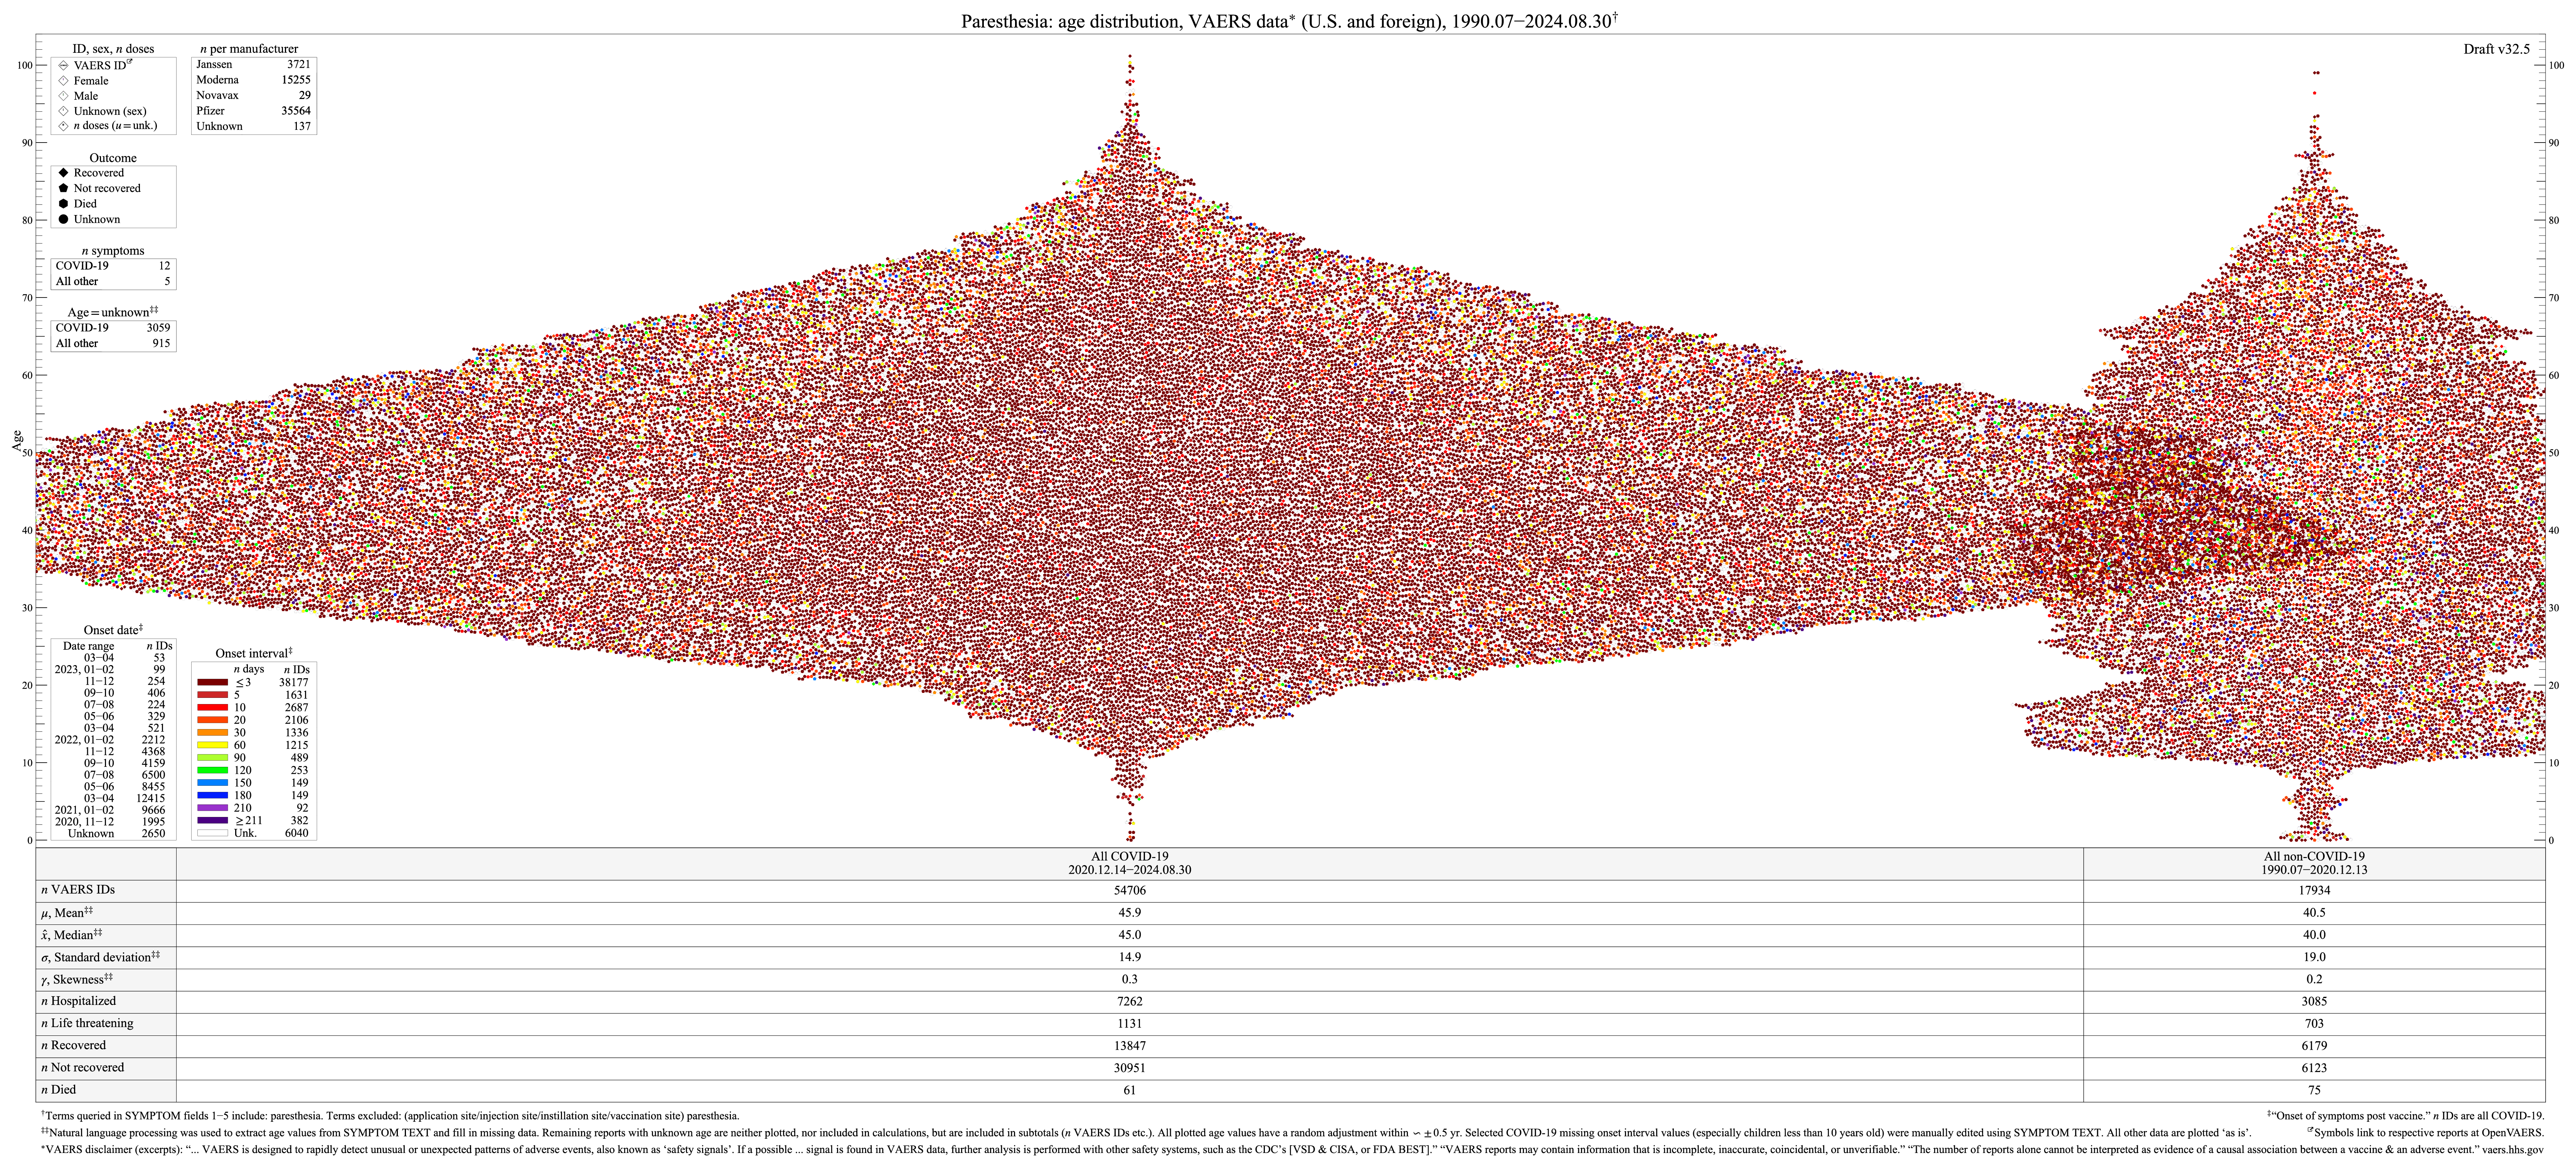
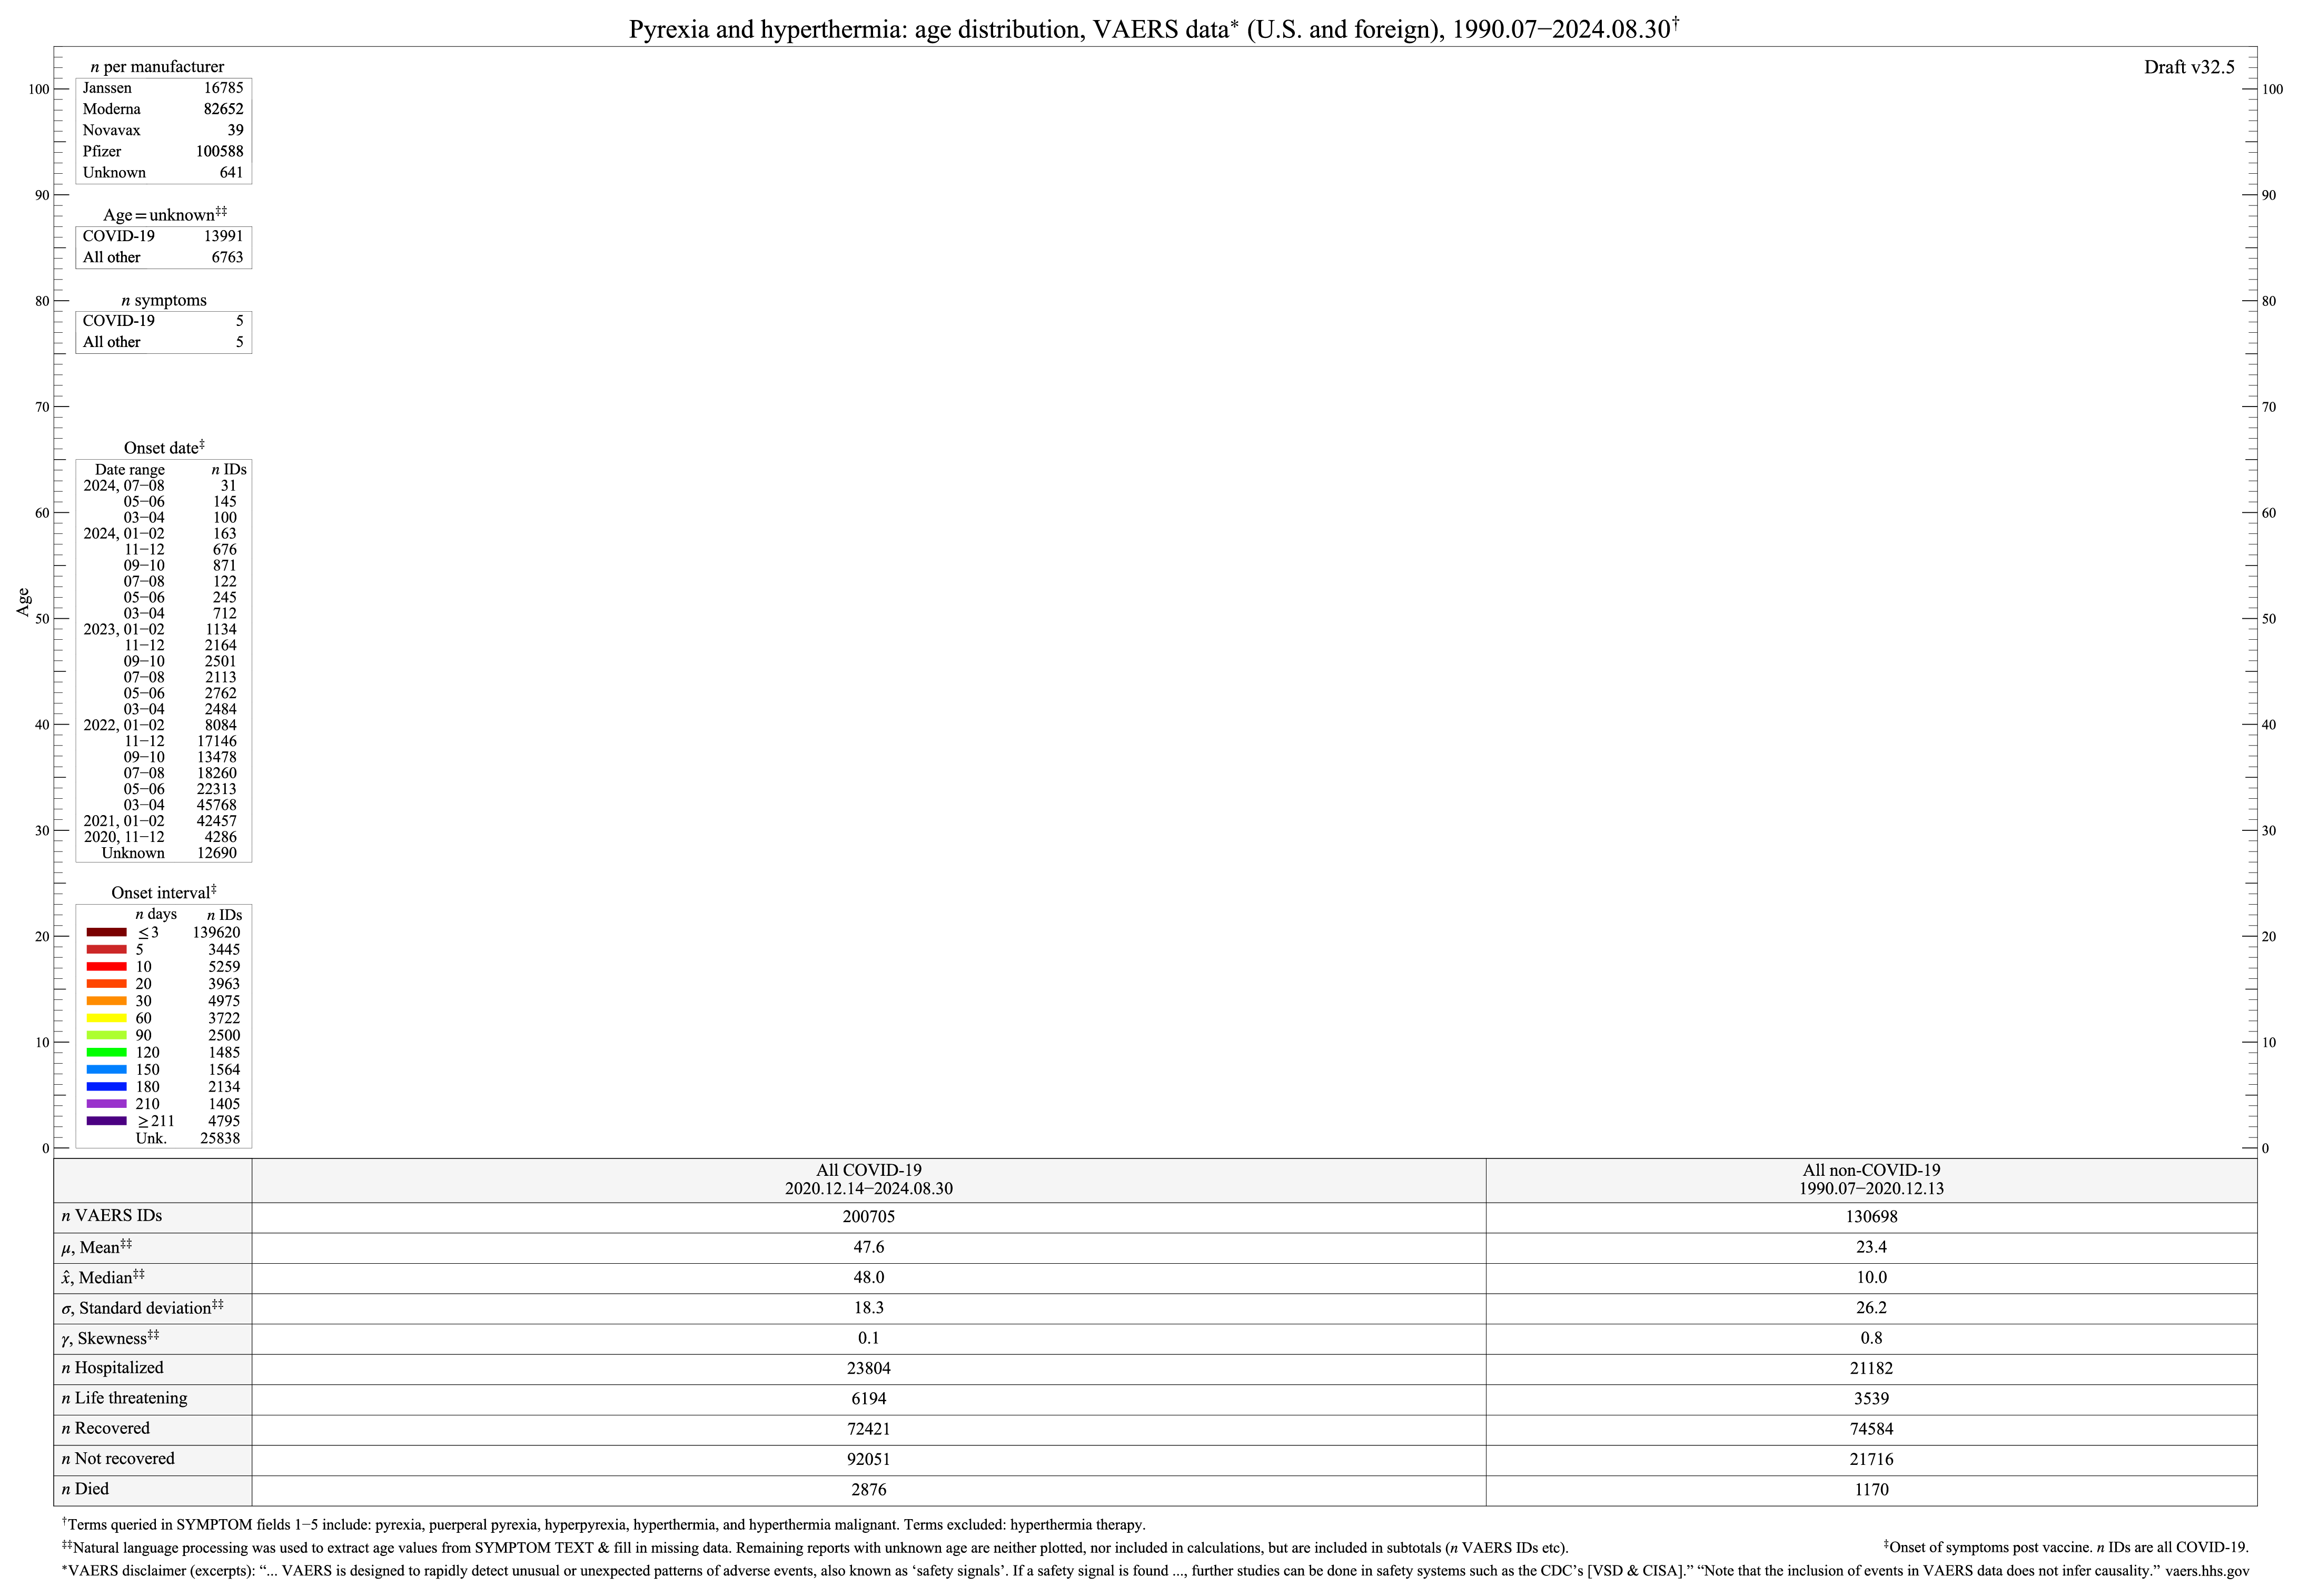
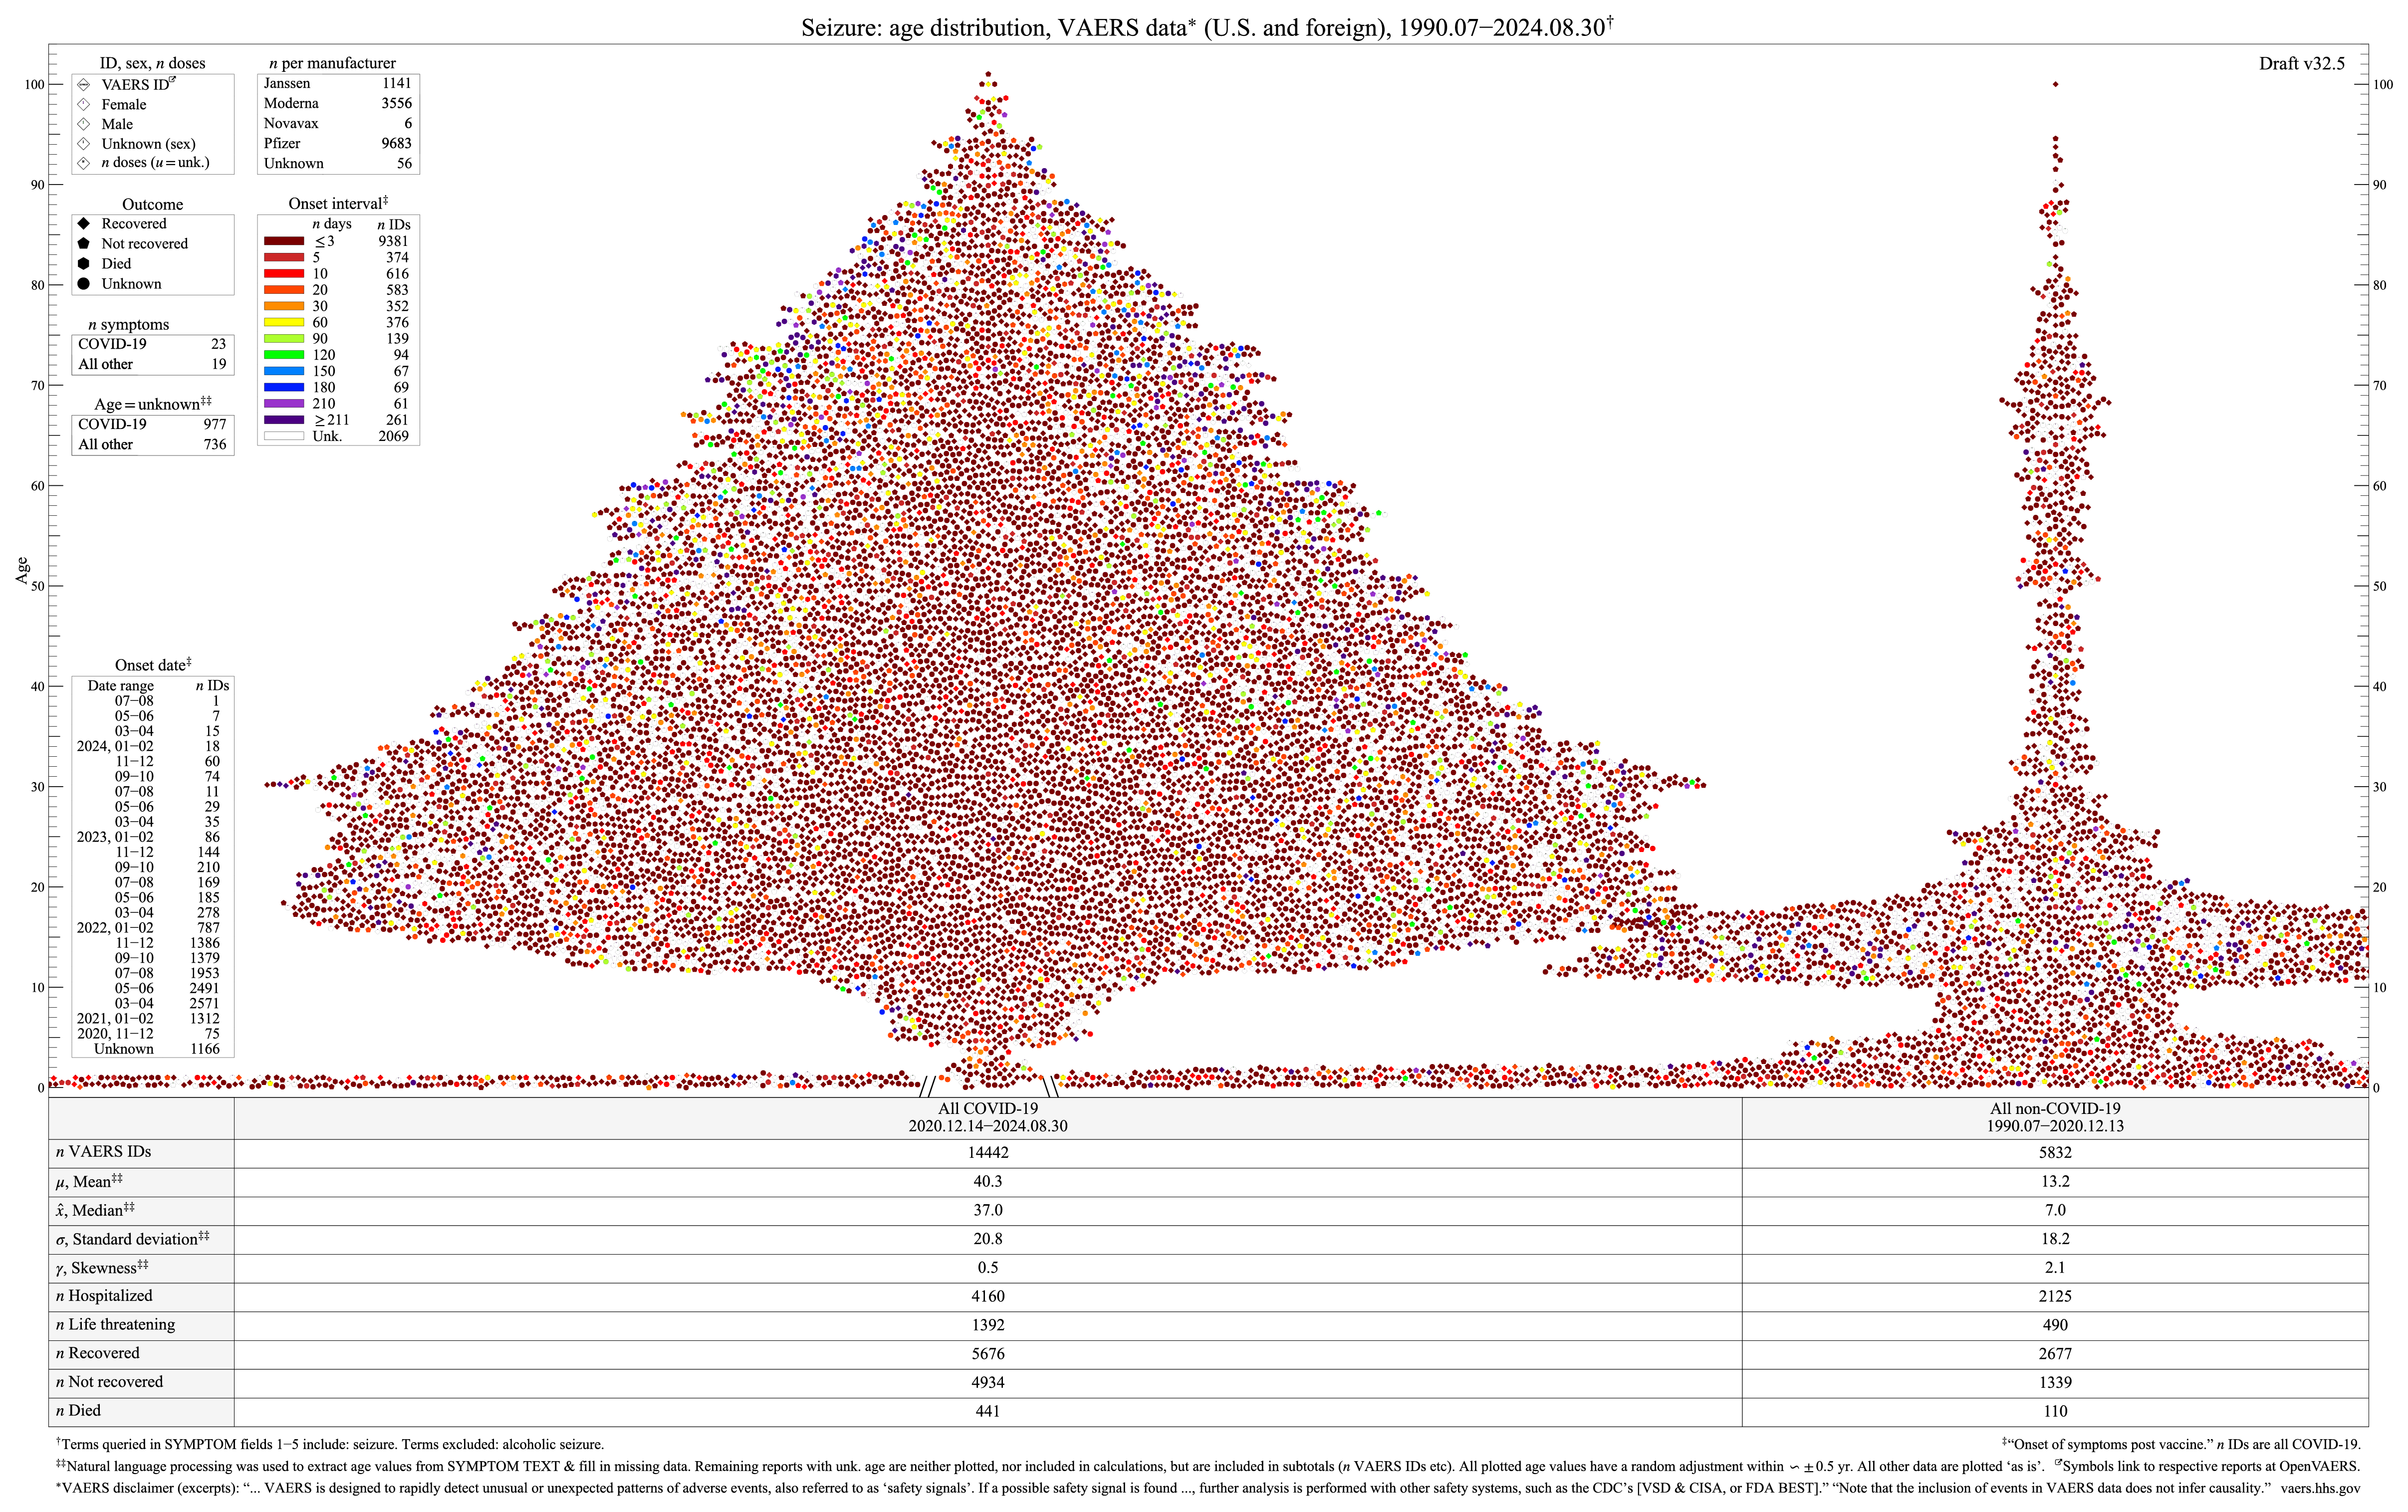
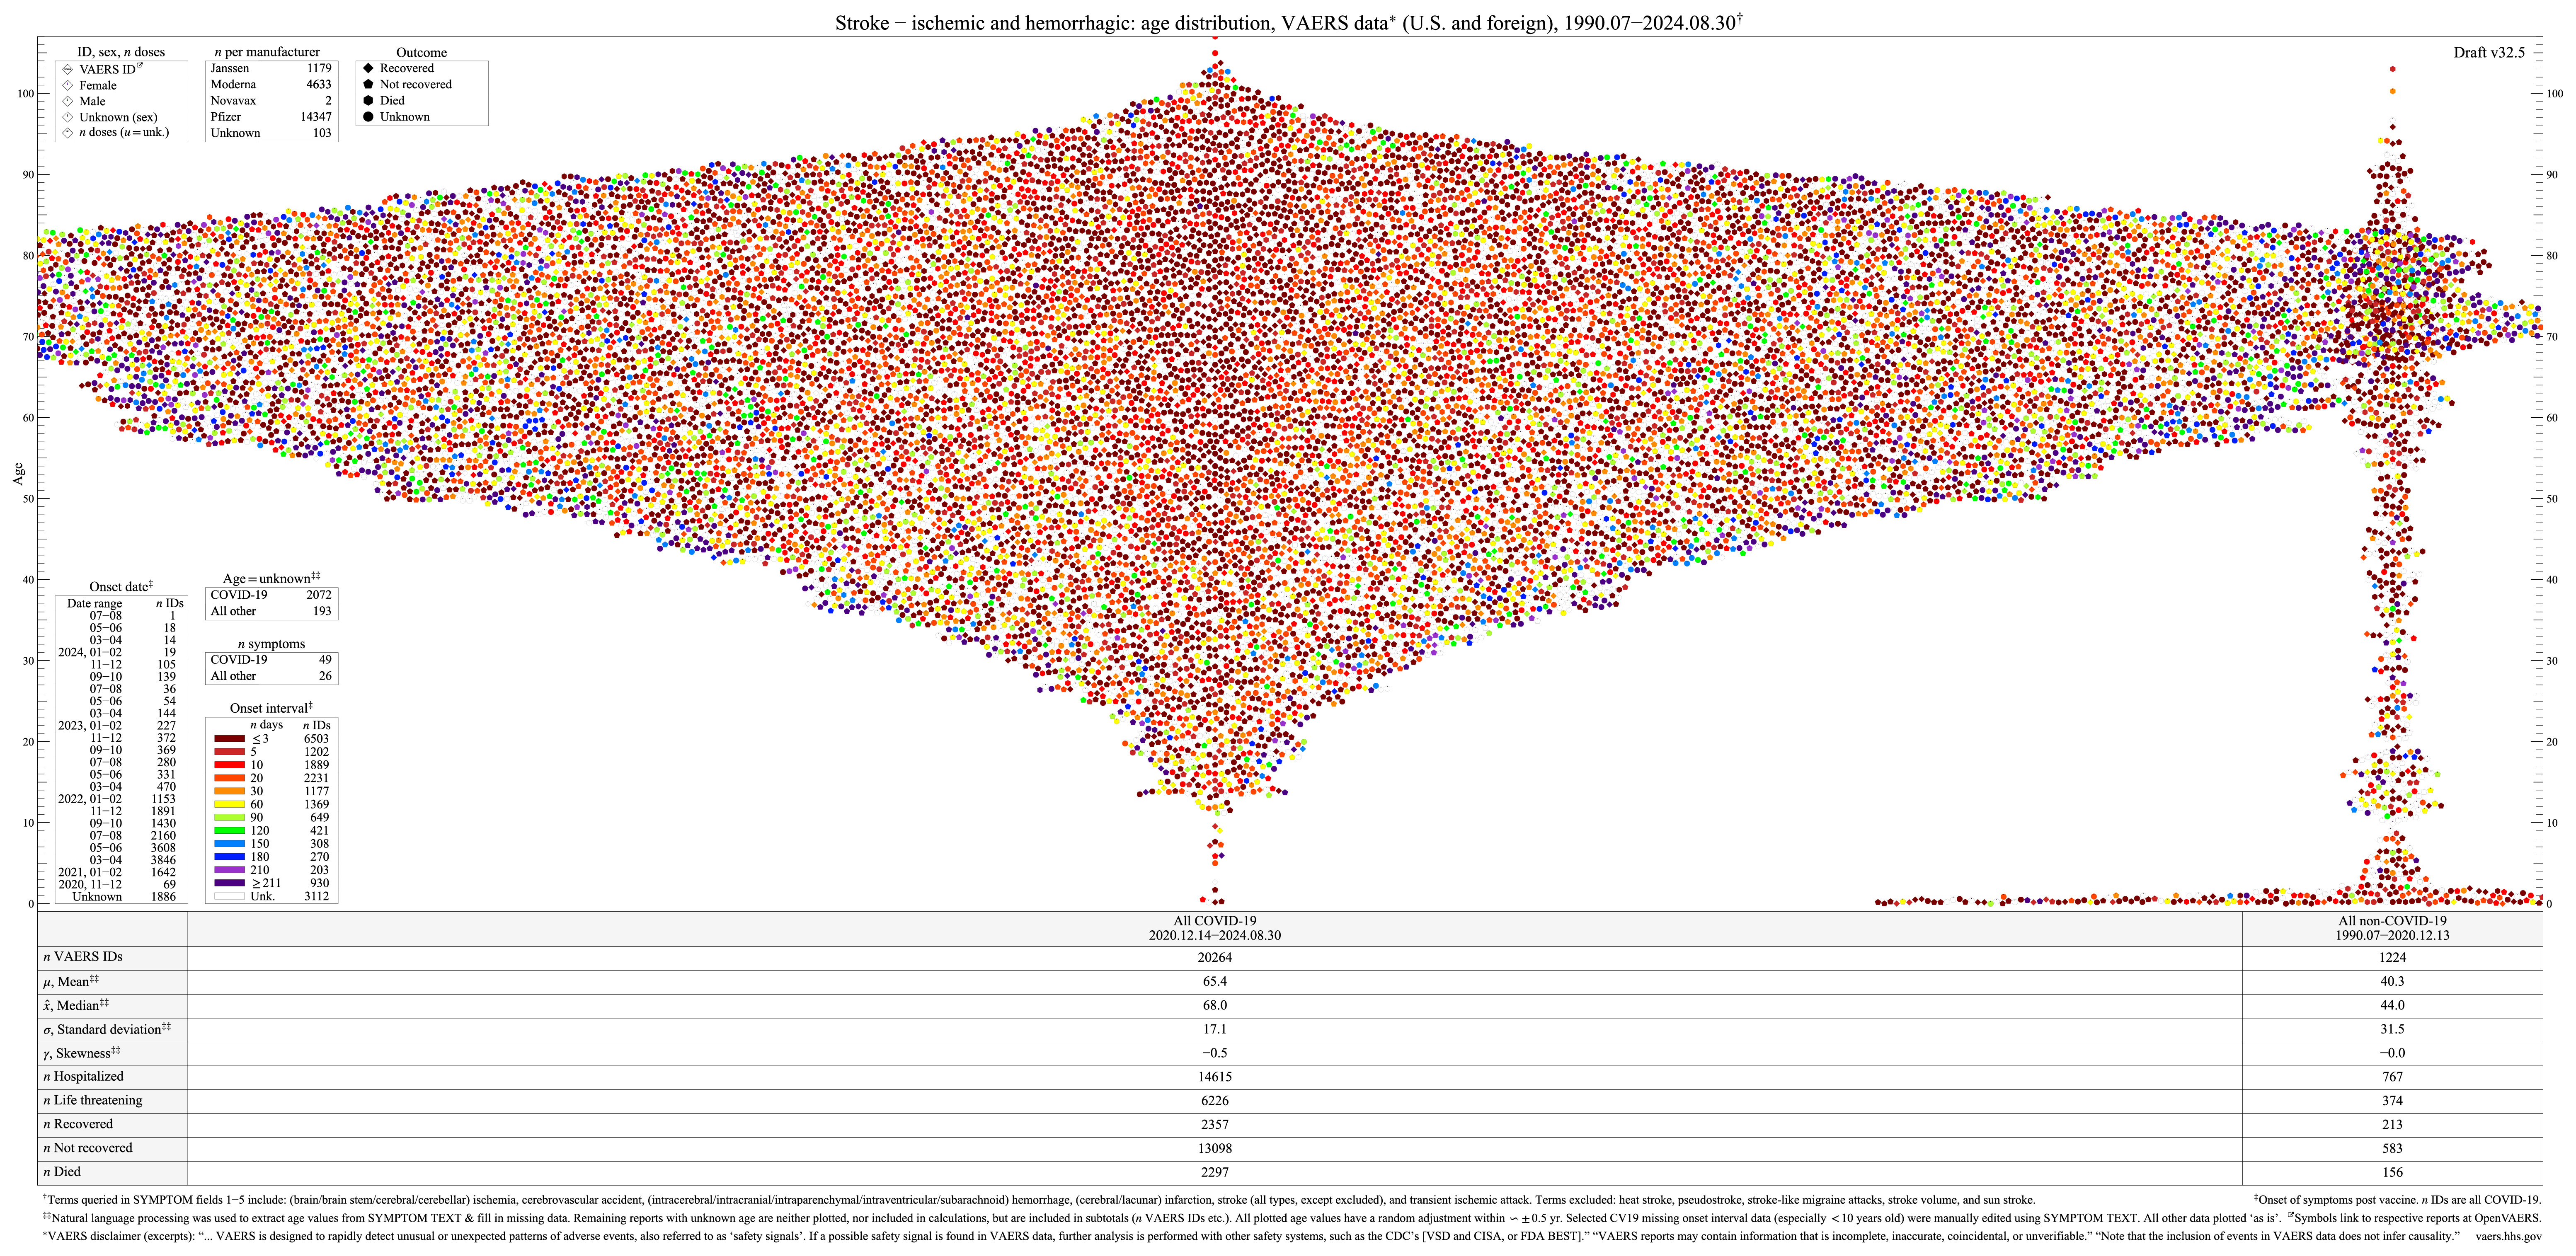
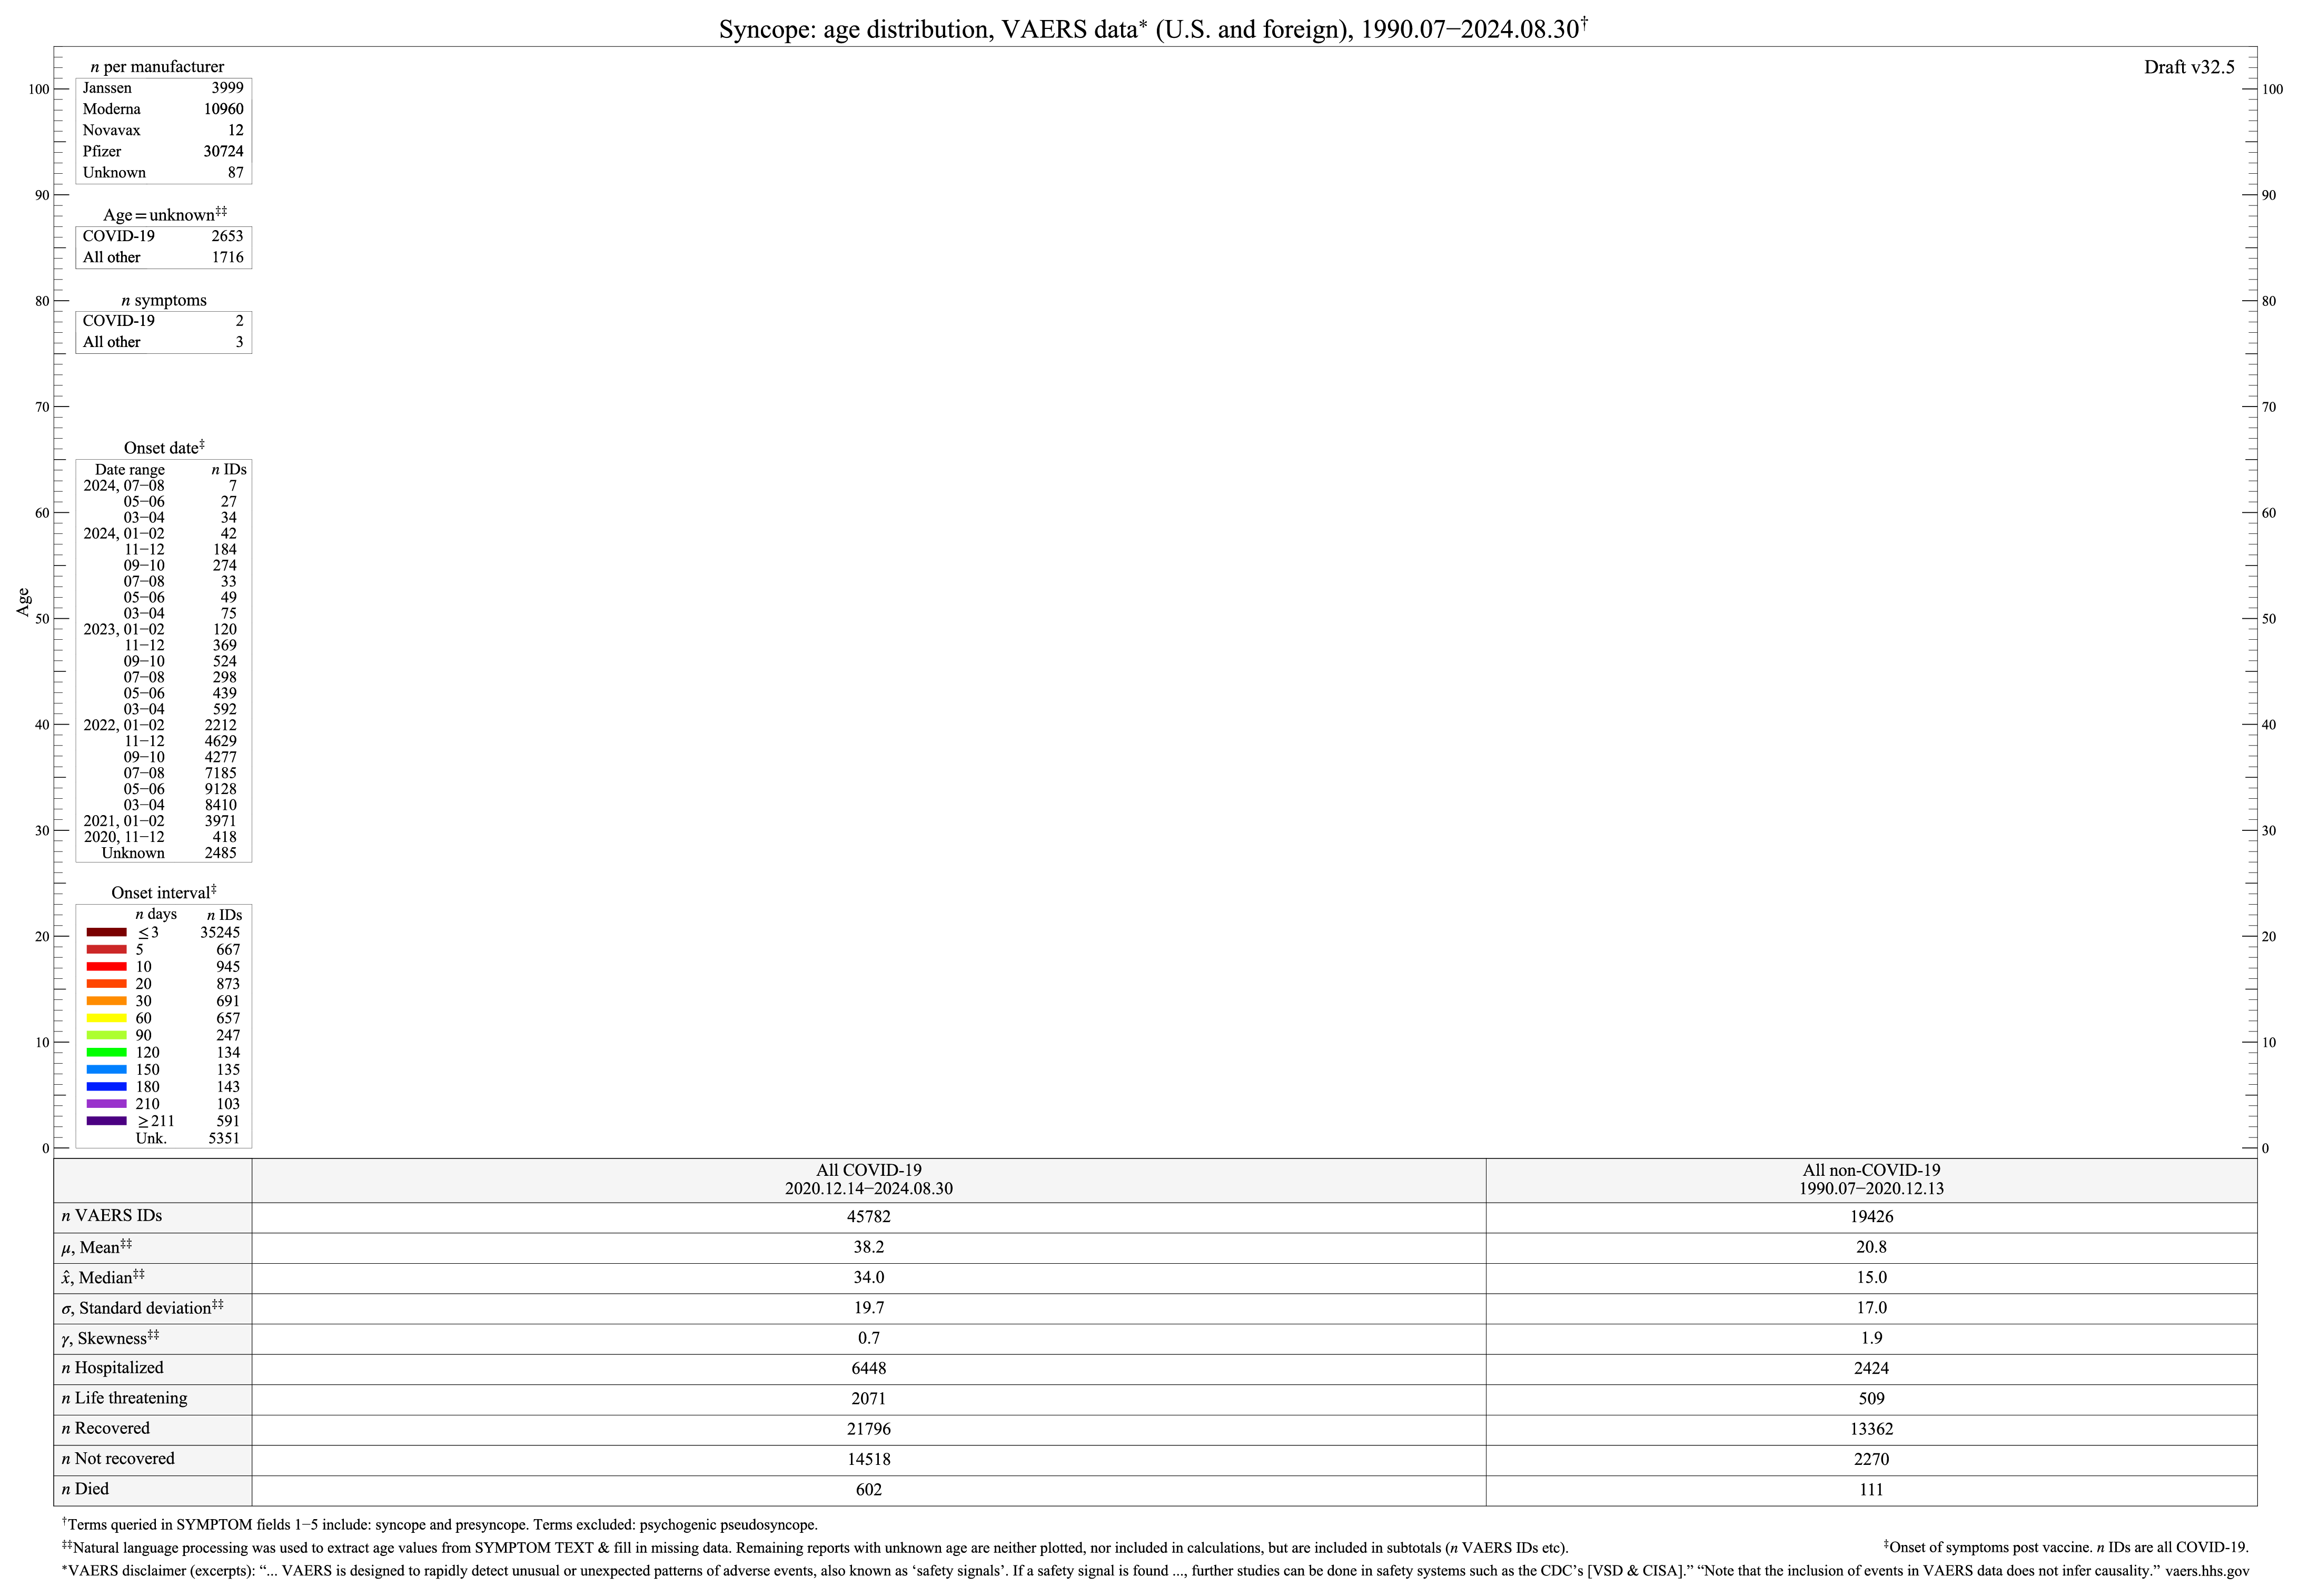
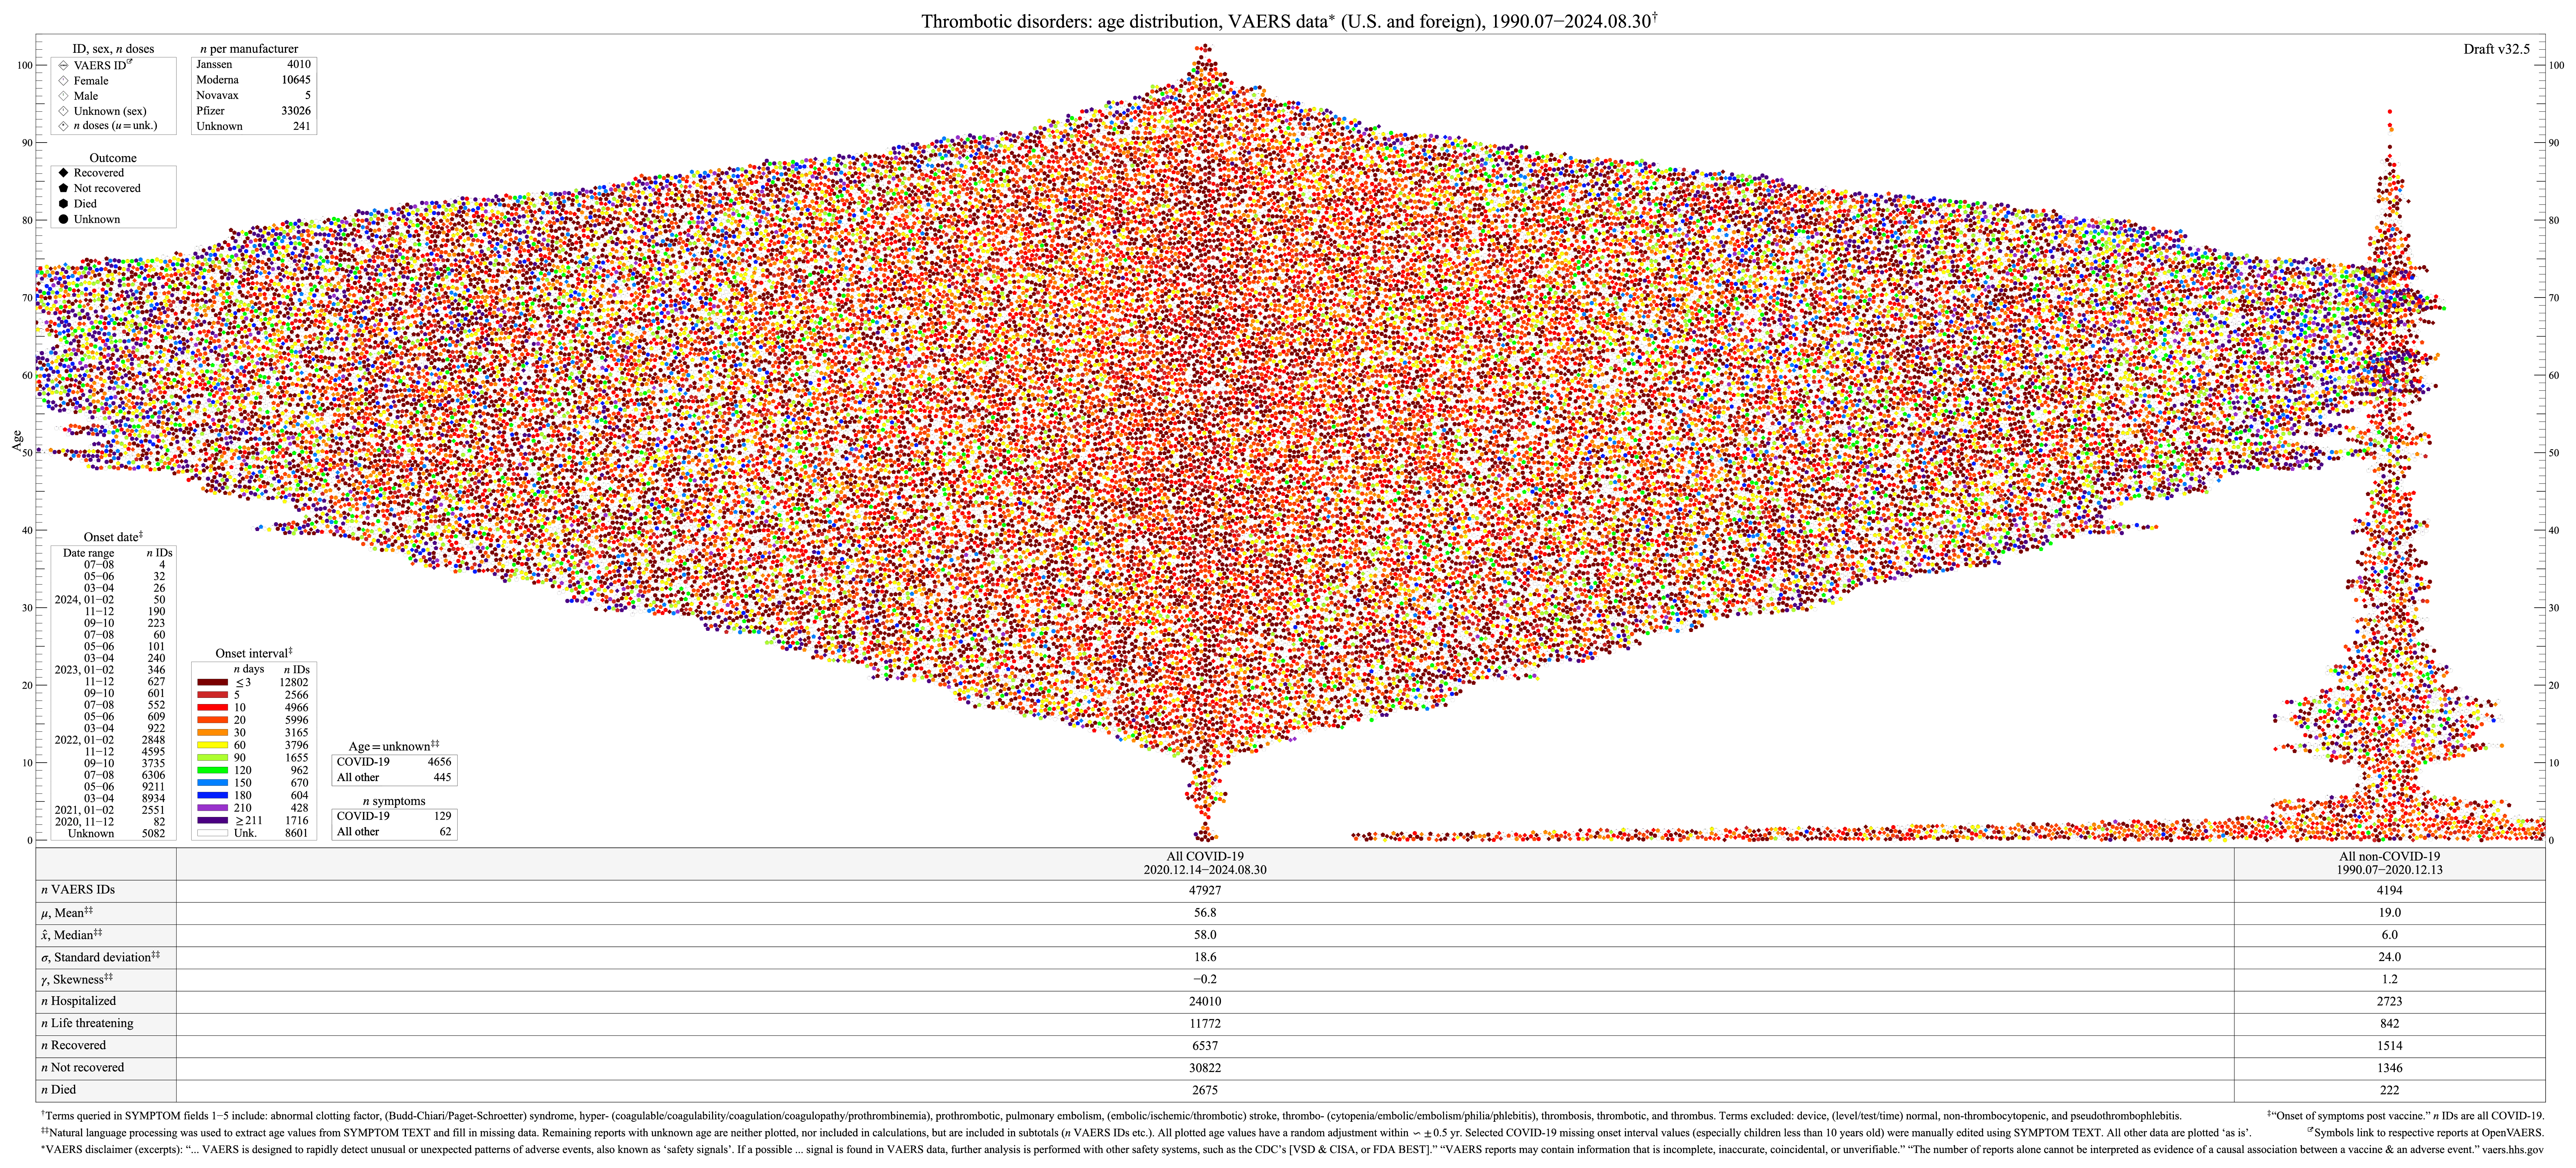
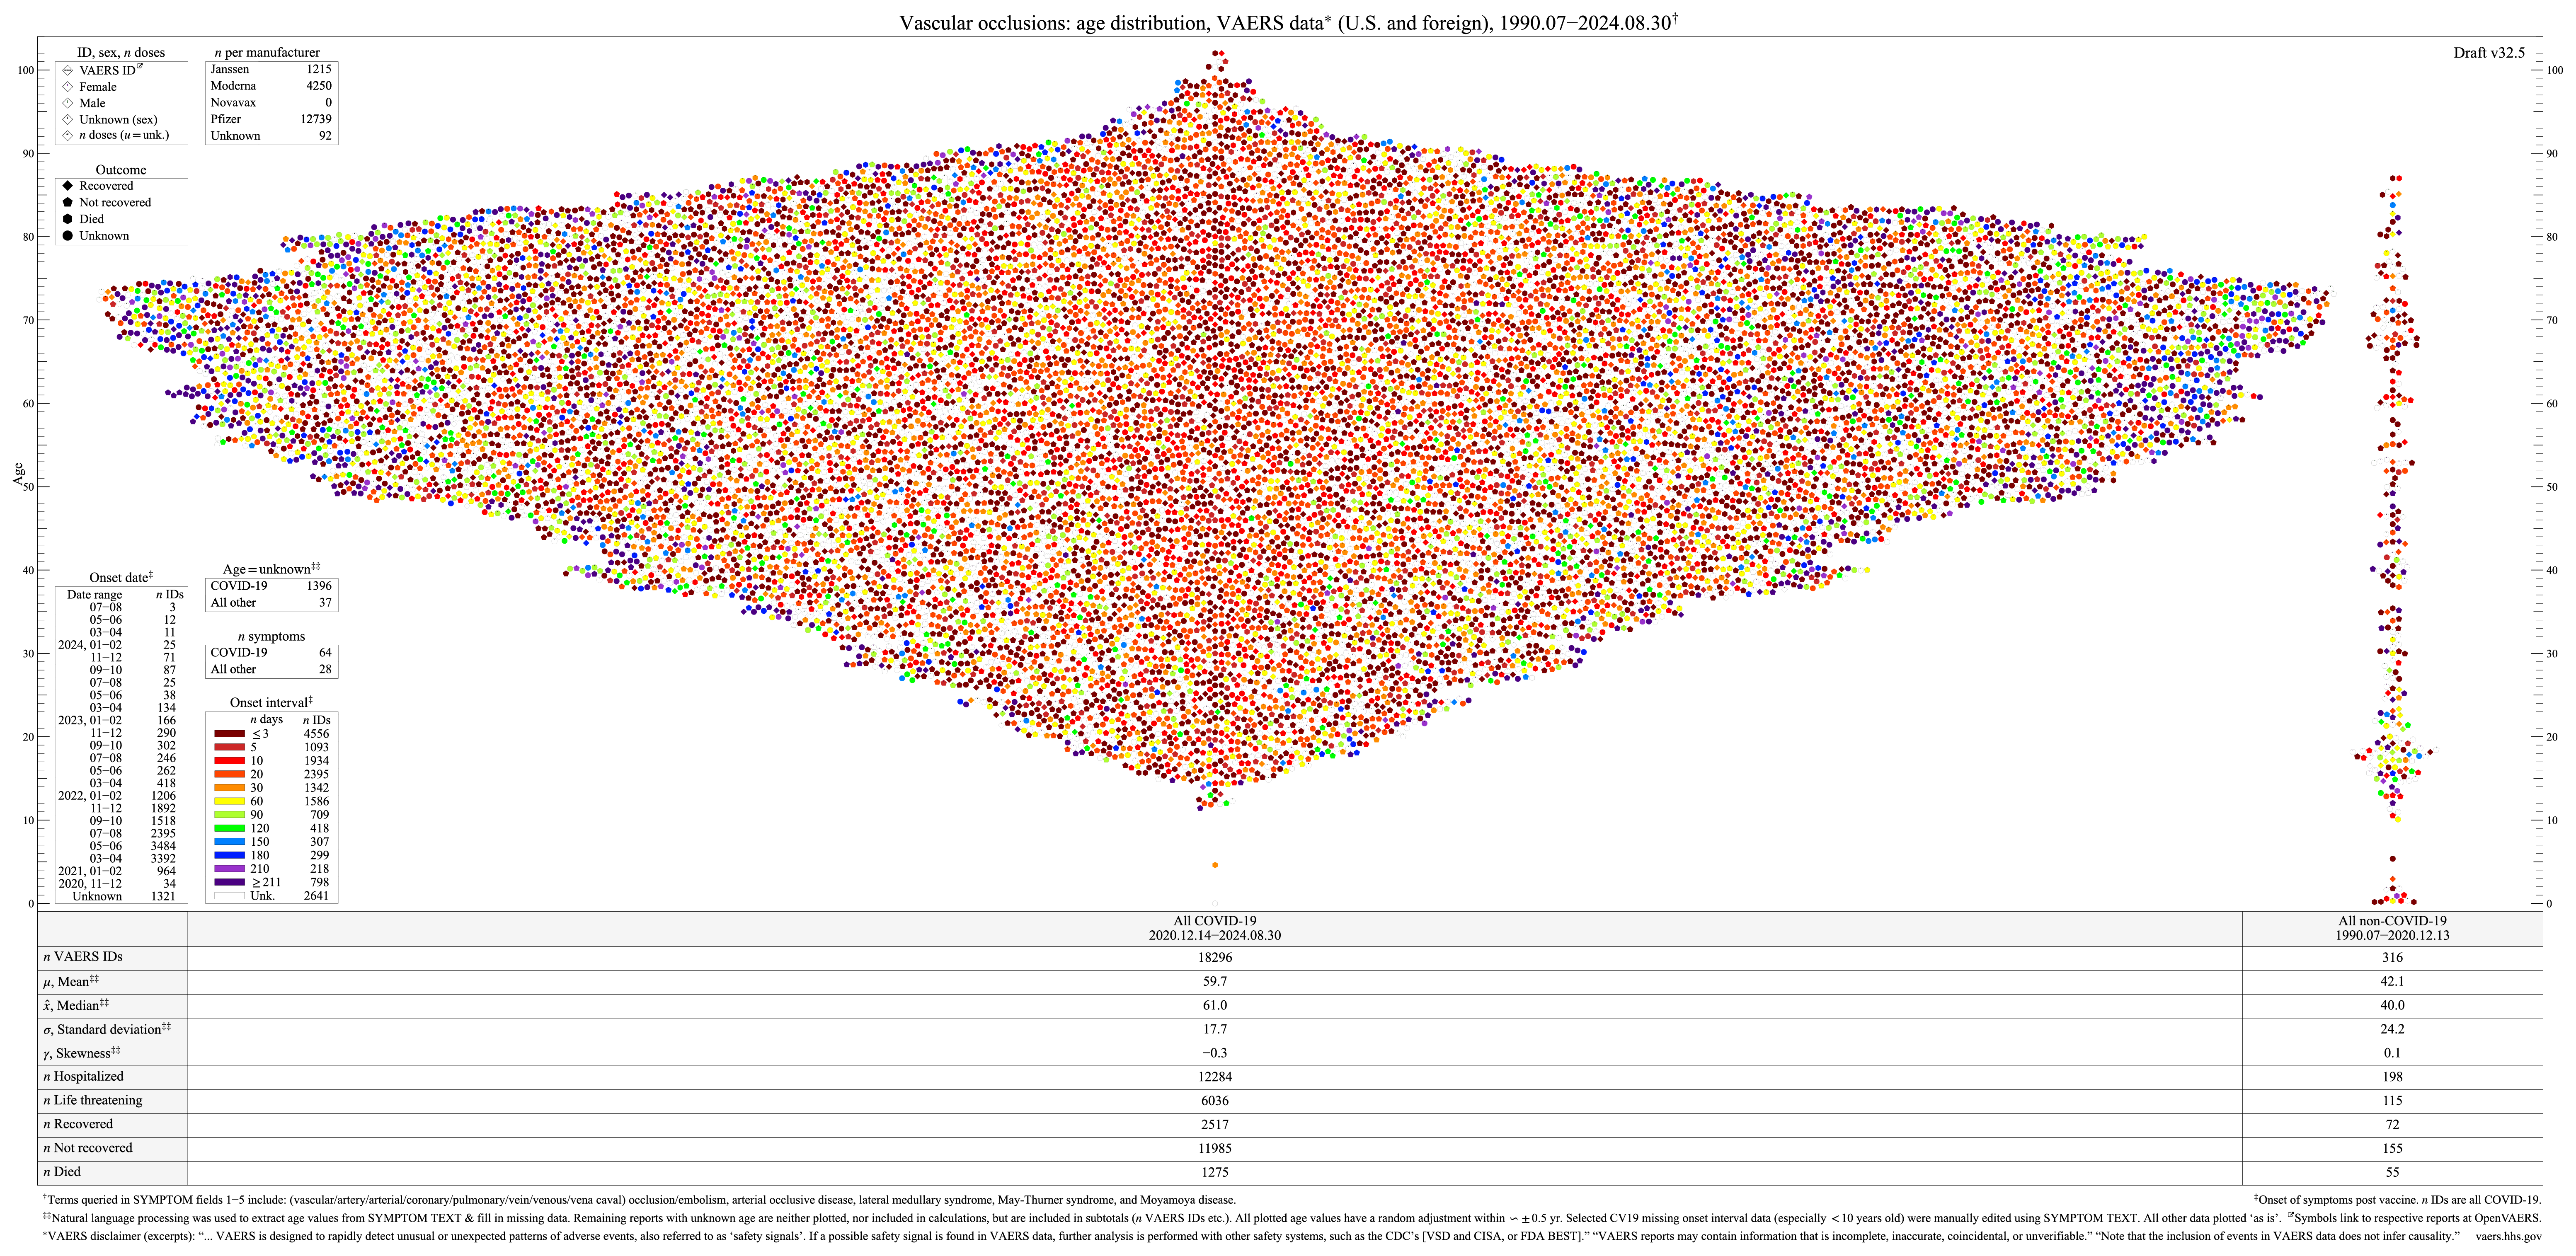
- Age: Natural language processing (NLP) was used to extract age values from the SYMPTOM TEXT field and fill in missing data. Most extracted COVID-19 age data for children less than 10 years old were manually confirmed using the SYMPTOM TEXT. All plotted age values have a random adjustment within ± 0.5 yr. The CDC and FDA have removed the SYMPTOM TEXT from EU reports after 2022.11.11 at the request of European regulators.
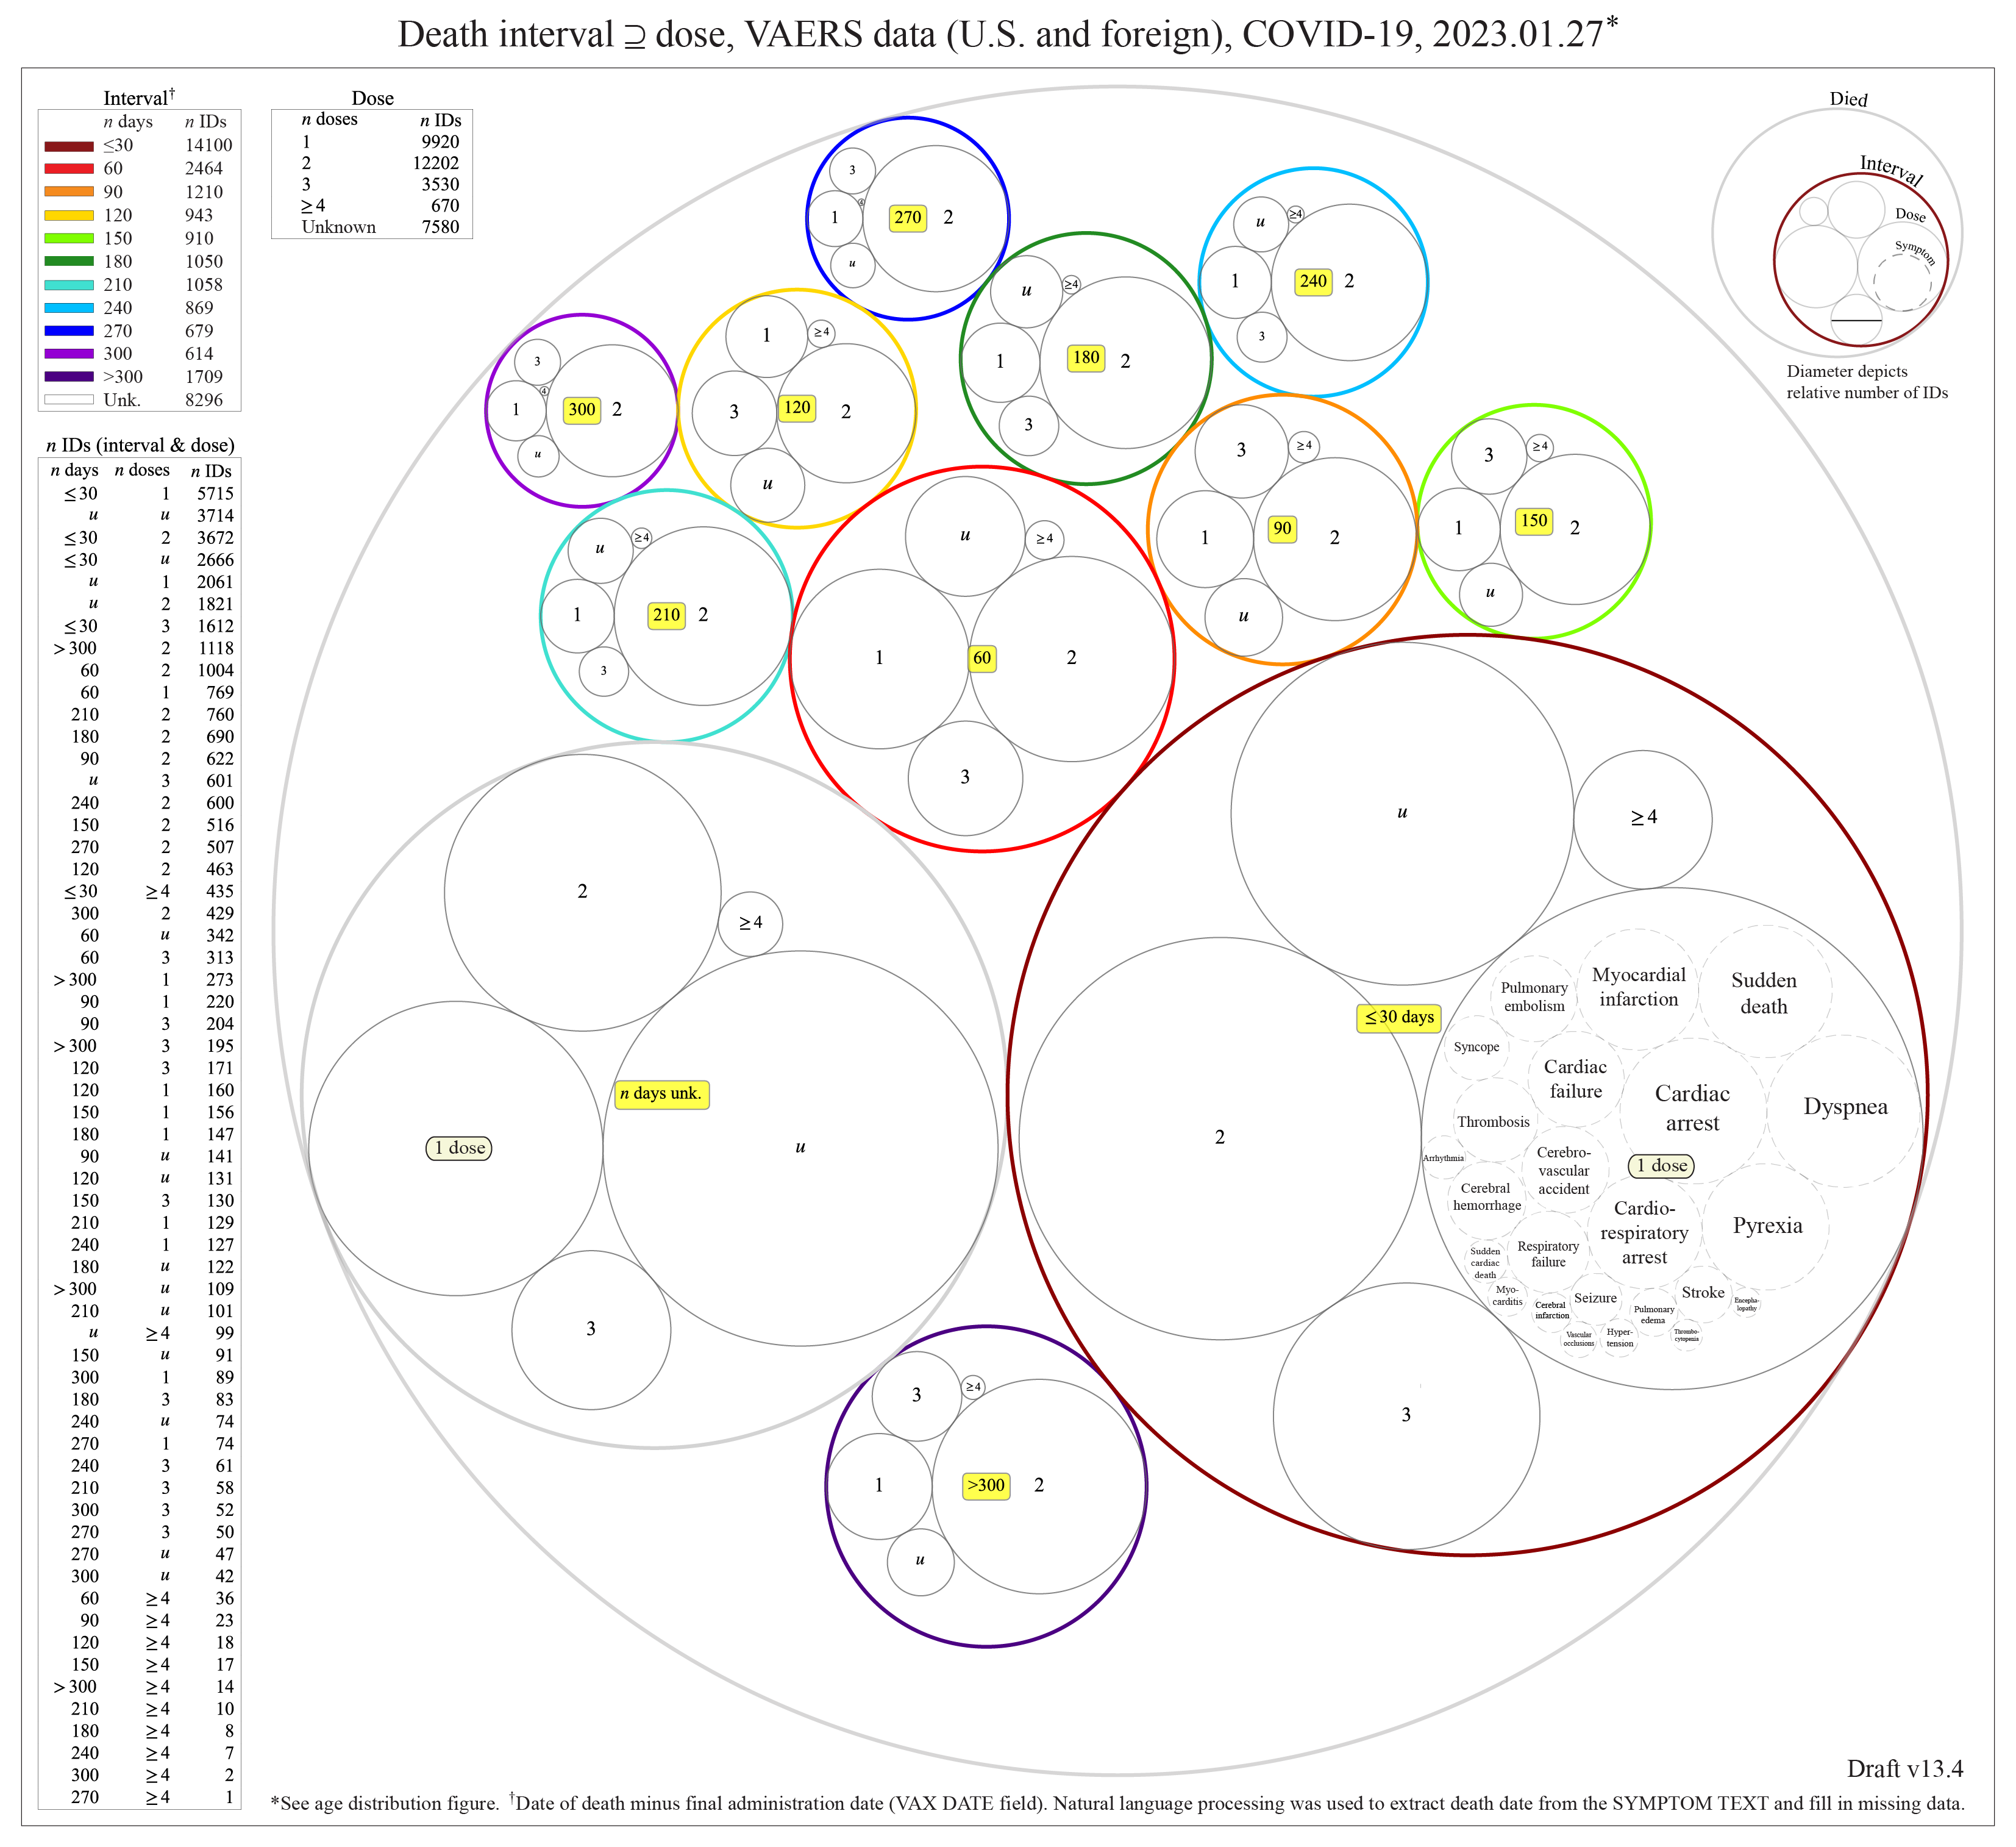
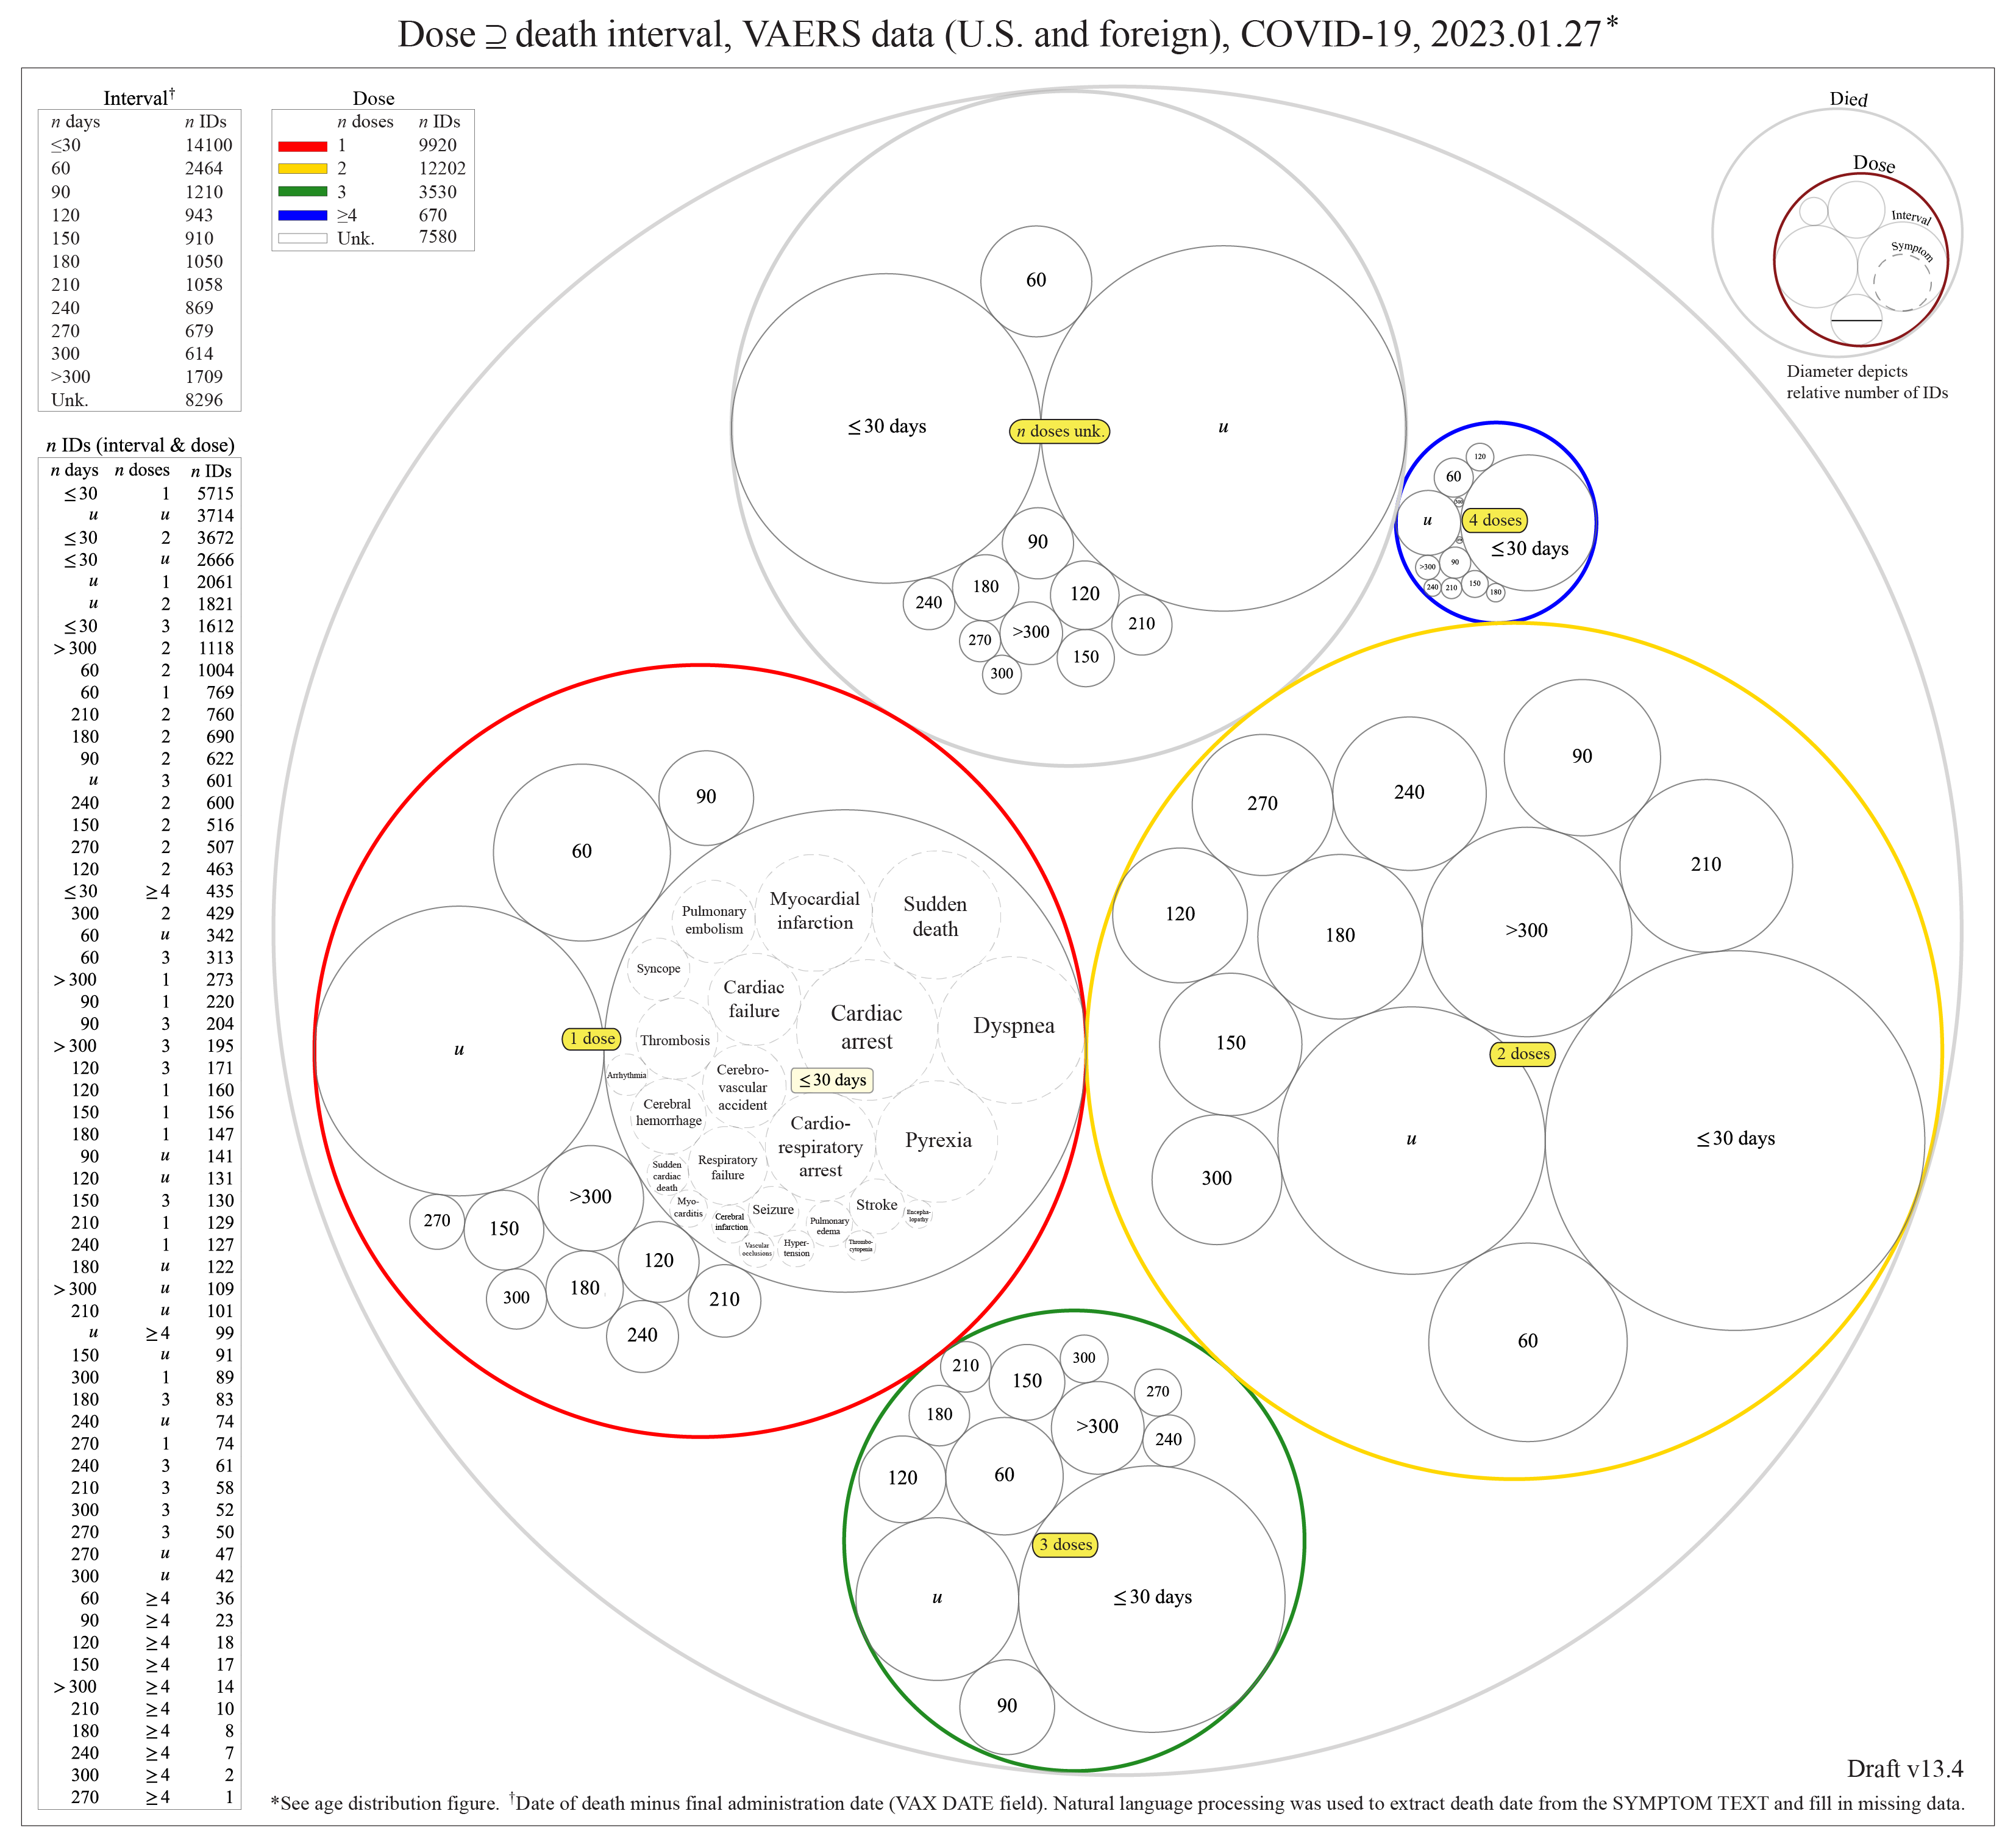
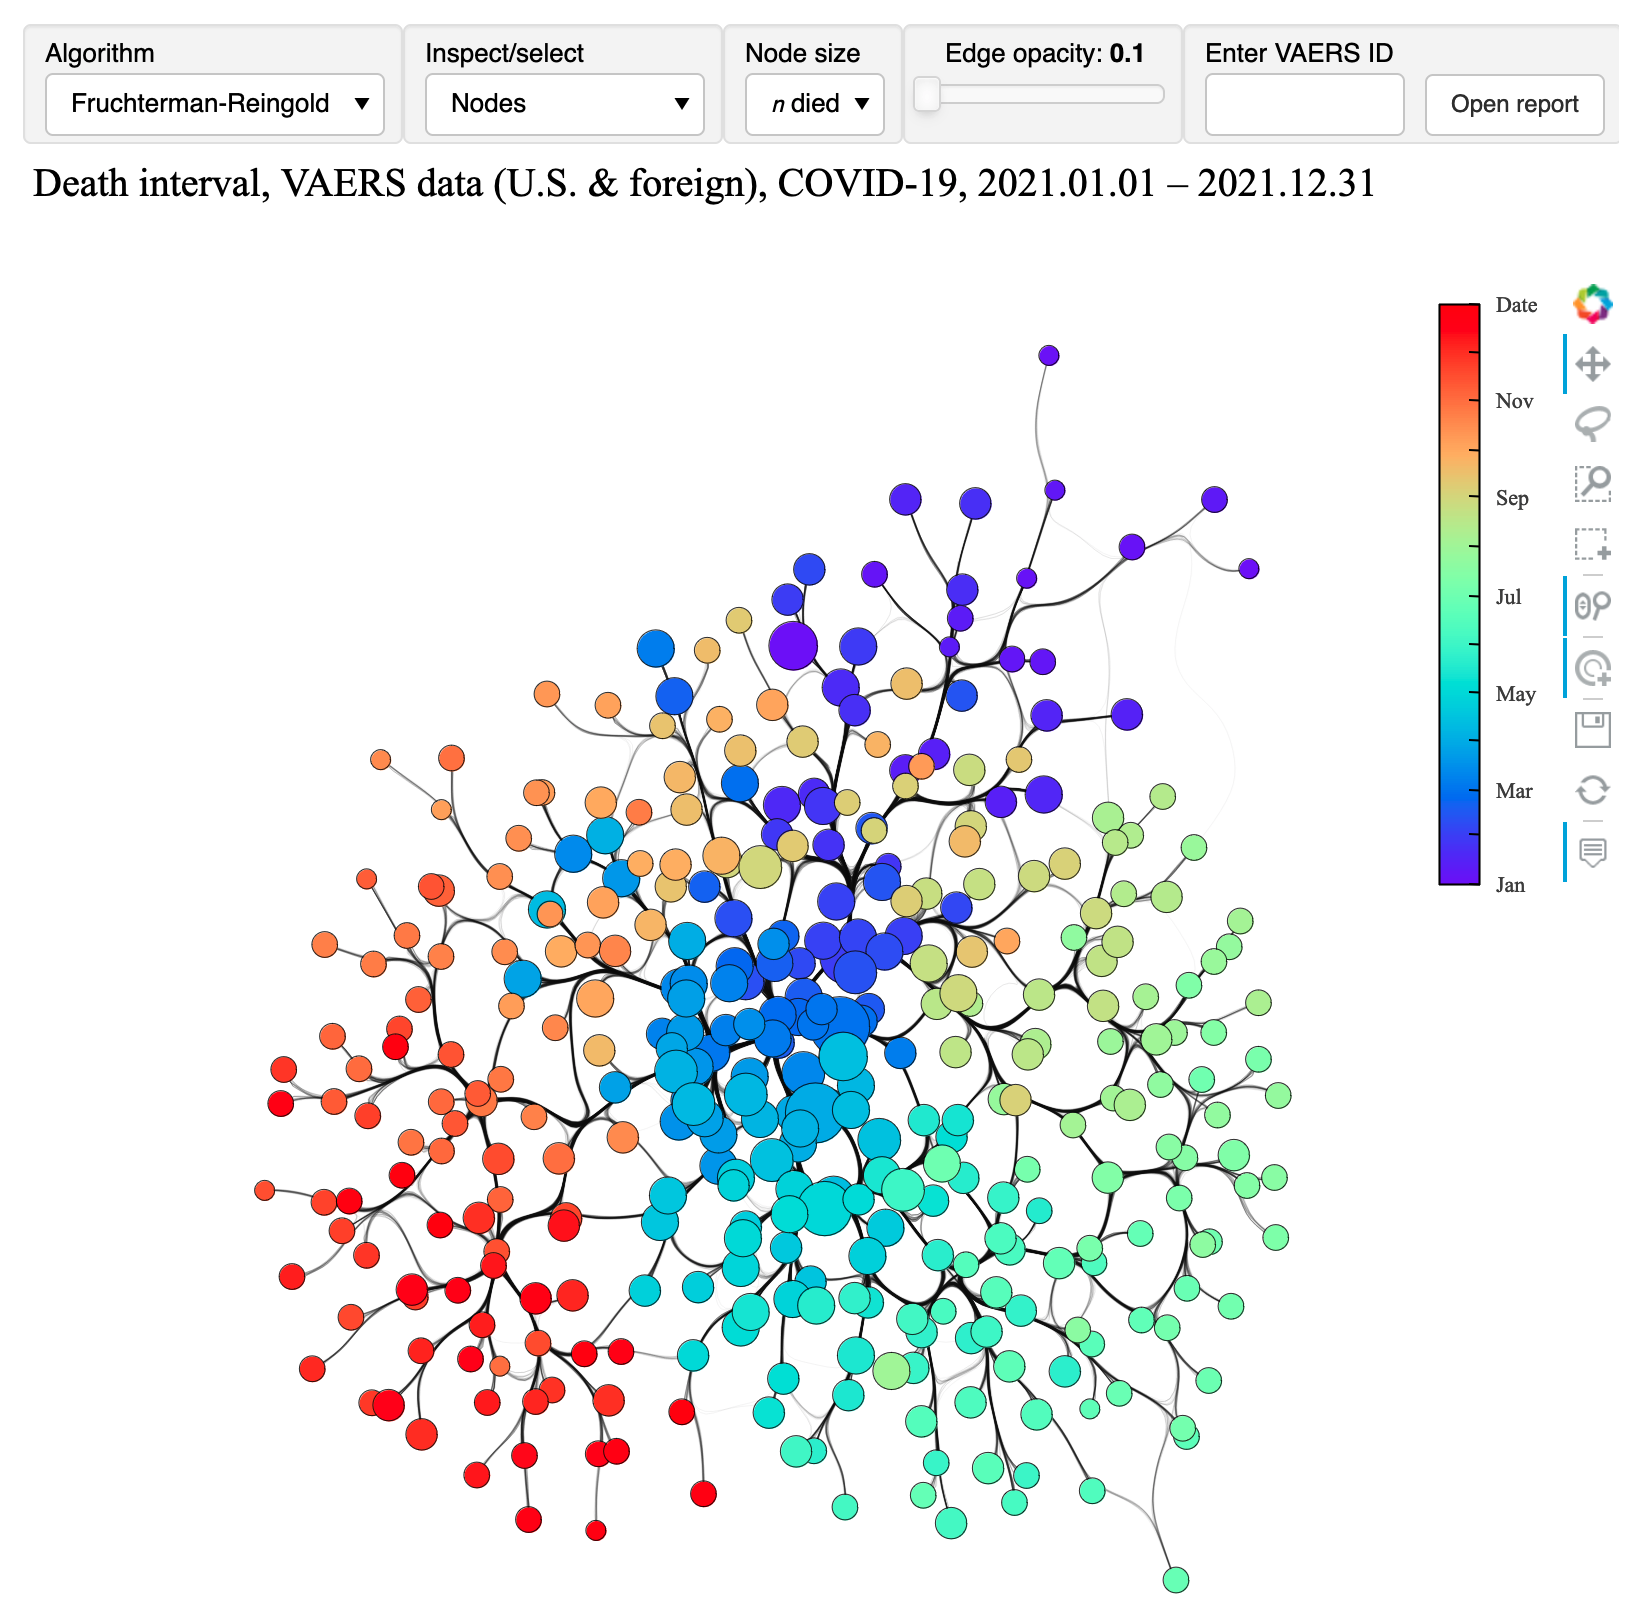
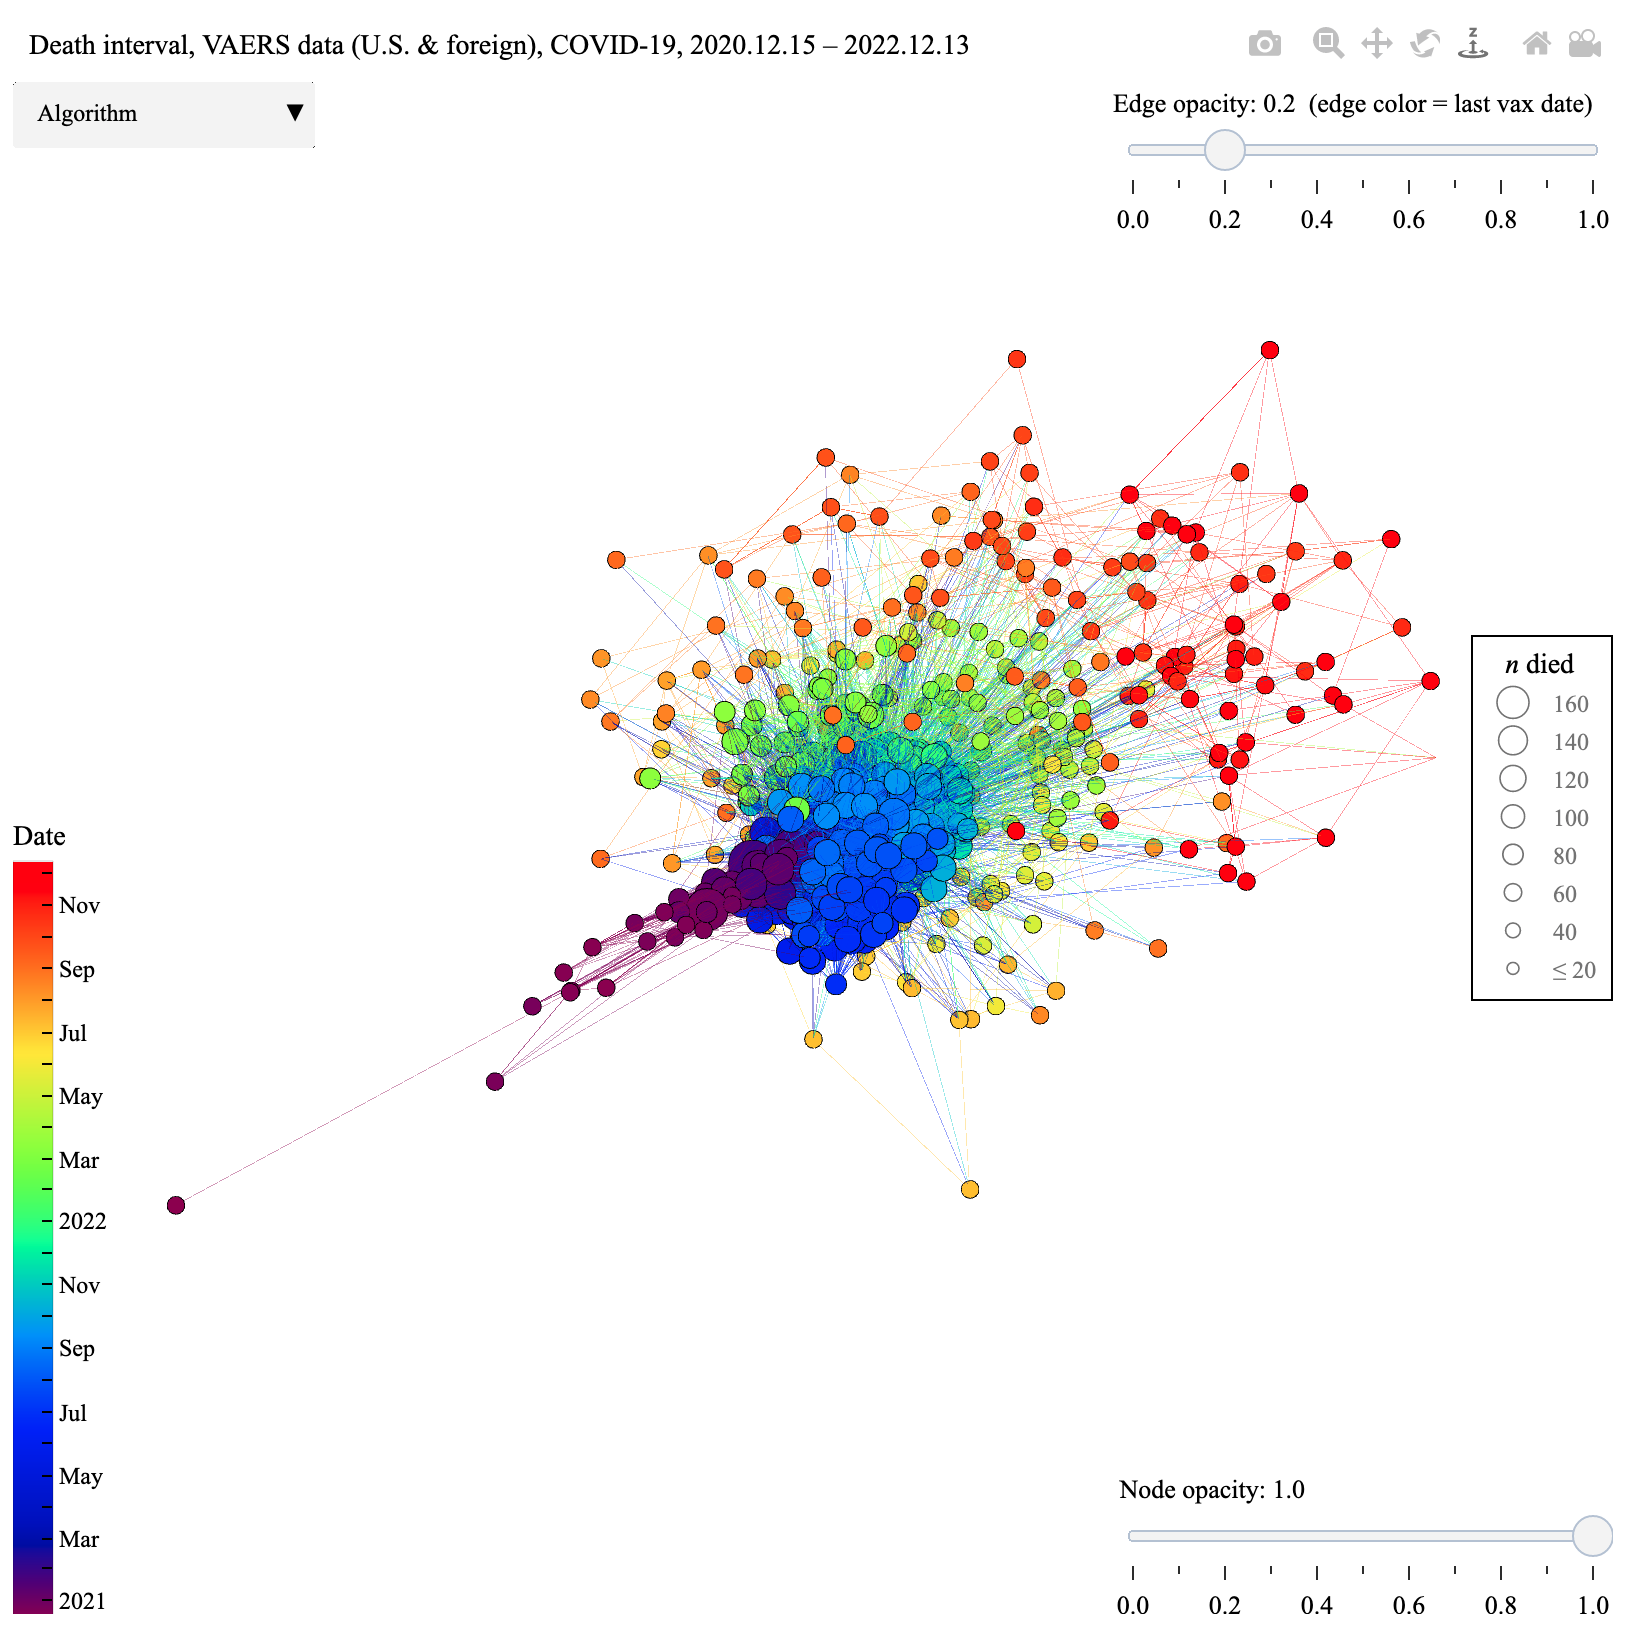
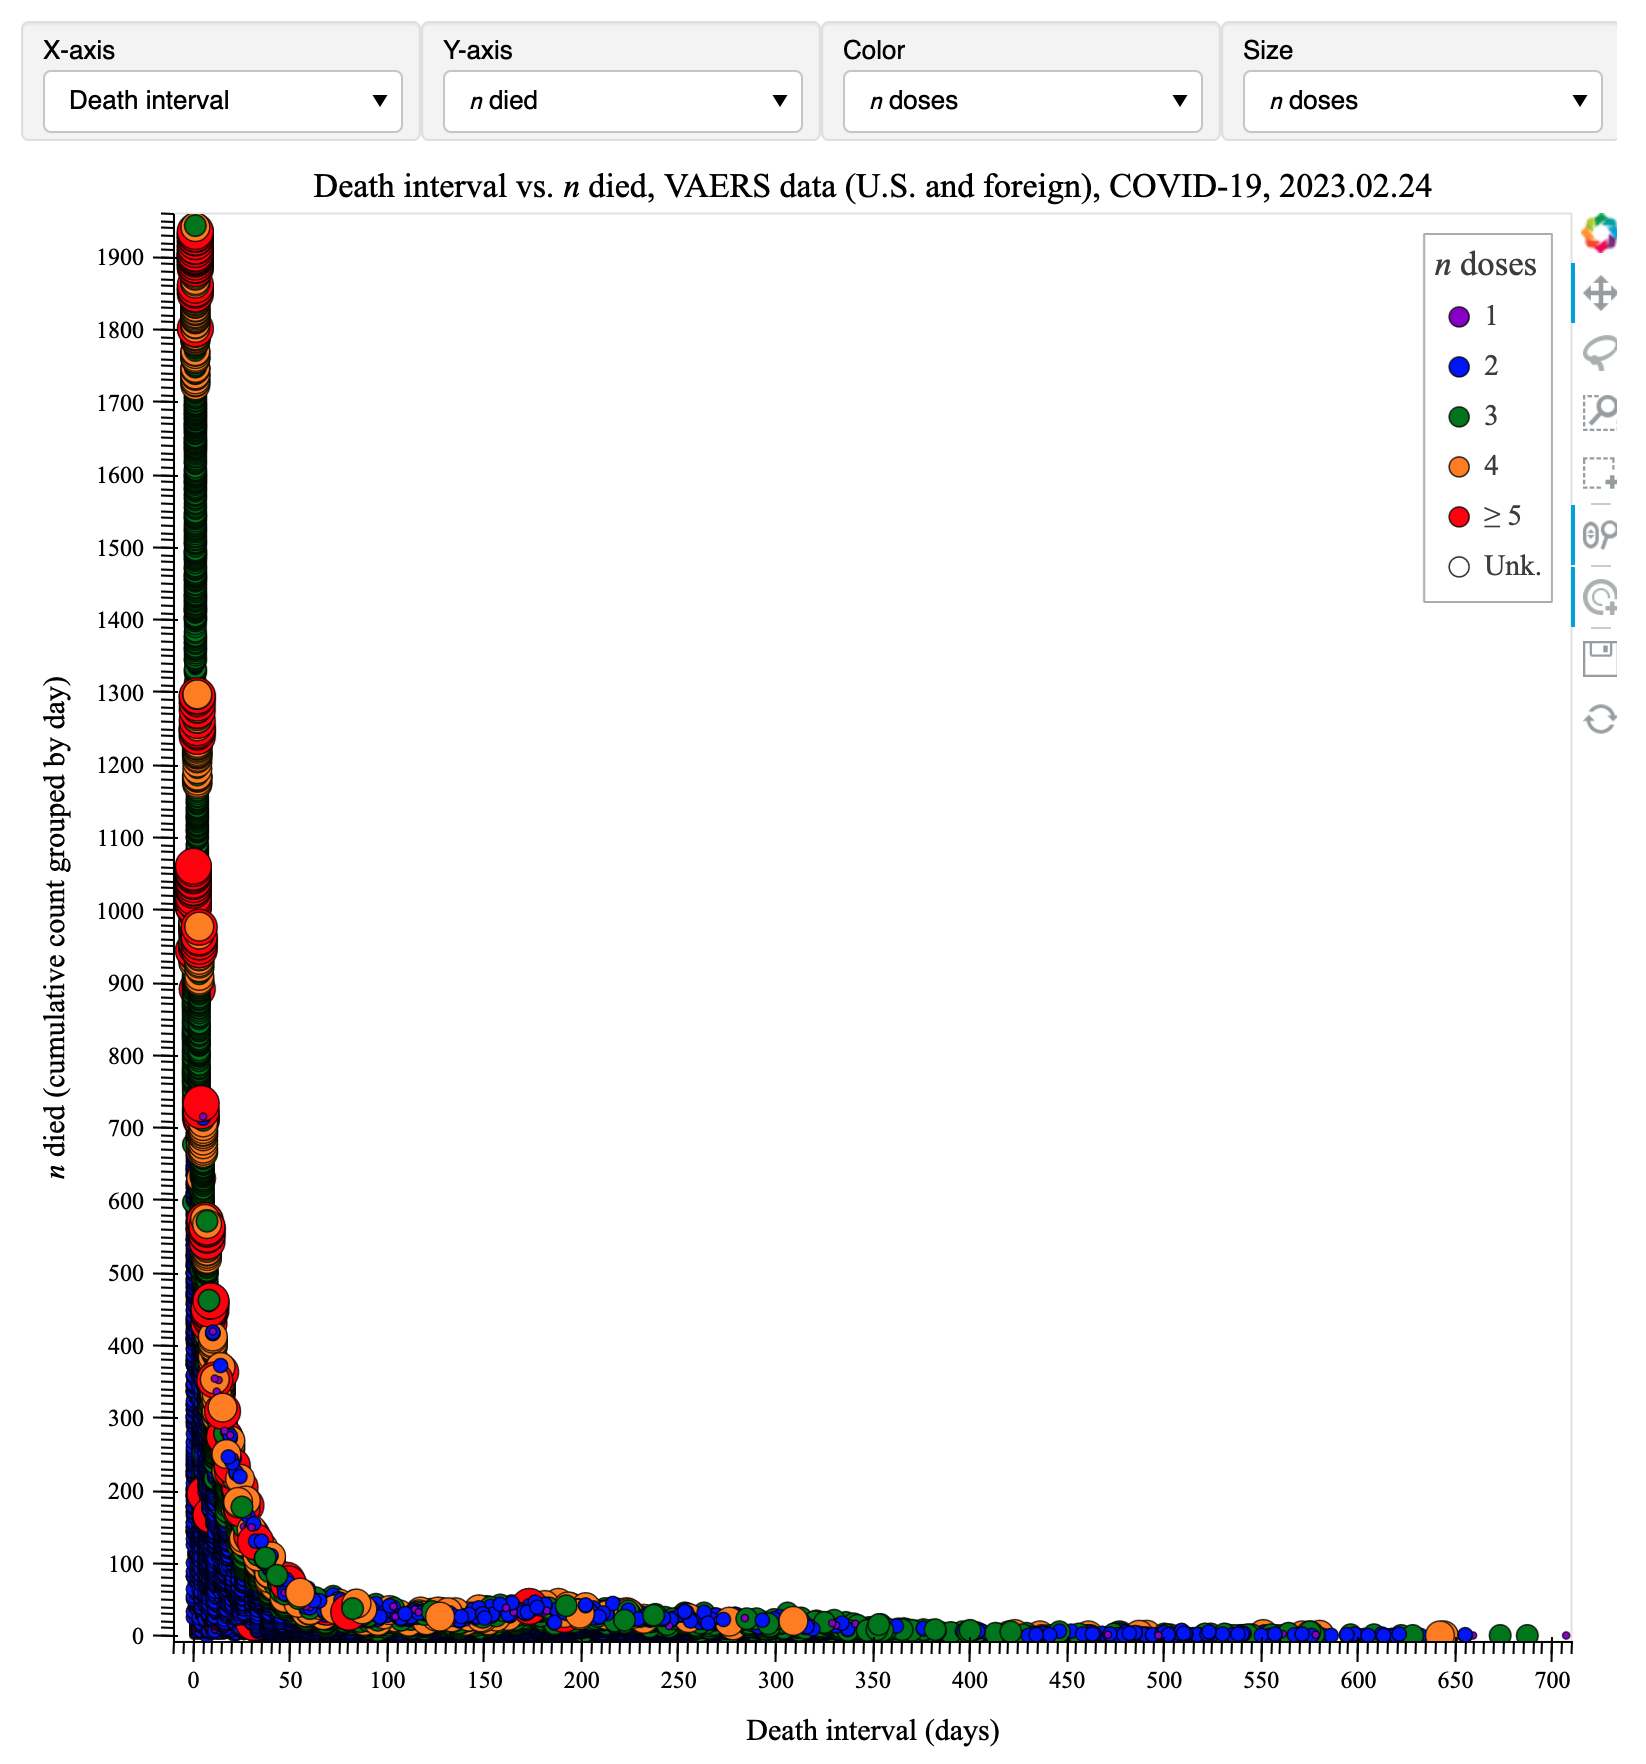
- Onset interval: VAERS reports have five symptom fields, but only one field for symptom onset date, and thus onset interval. Onset interval (if missing or incorrect) was calculated using the most recent vaccination date (VAX DATE field), and also manually edited and confirmed using SYMPTOM TEXT (especially for children less than 10 years old). NLP was used to extract death dates from SYMPTOM TEXT and fill in missing COVID-19 data. All other data are plotted ‘as is’.
- Under-reporting: Various researchers have estimated vaccine adverse event under-reporting, e.g. Lazarus et al. (2010) report that “fewer than 1% of vaccine adverse events are reported.” Under-reporting varies with symptom/reaction, and under-reporting of death is potentially lower than many reactions. [Conservative] estimates of an average multiplicative under-reporting factor (excluding death) range from 10 to 50+. (e.g. CMS, V-Safe)
- Occurrence rates: “The lack of information regarding an unvaccinated comparison group precludes determination of the vaccine’s role. It is not possible to determine occurrence rates of a reported adverse event because it is not known how many people were vaccinated (denominator), how many vaccinated people did not experience an adverse event or how many unvaccinated people experienced the adverse event.” (Meissner 2016)
- Manufacturers: Novavax reports first appeared in the VAERS data in 2022.09.
- Confounding factors: Potential confounding factors include: age, genetic predisposition, pre-existing conditions, comorbidities, and/or previous/concurrent SARS-CoV-2 infection. Reports include both new-onset symptoms, and aggravation of pre-existing/dormant conditions.
- Future work: Further develop automation, natural language processing, quality control, statistical analysis, etc.
- VAERS disclaimer (excerpts): “While very important in monitoring vaccine safety, VAERS reports alone cannot be used to determine if a vaccine caused or contributed to an adverse event or illness. VAERS reports may contain information that is incomplete, inaccurate, coincidental, or unverifiable. Reports to VAERS can also be biased. As a result, there are limitations on how the data can be used scientifically. Data from VAERS reports should always be interpreted with these limitations in mind.”
“The strengths of VAERS are that it is national in scope and can often quickly detect an early hint or warning of a safety problem with a vaccine.” “VAERS is designed to rapidly detect unusual or unexpected patterns of adverse events, also known as ‘safety signals’. If a possible safety signal is found in VAERS, further analysis is performed with other safety systems, such as [VSD, CISA, or FDA BEST].” “Key considerations and limitations of VAERS data:”
- “The number of reports alone cannot be interpreted as evidence of a causal association between a vaccine and an adverse event, or as evidence about the existence, severity, frequency, or rates of problems associated with vaccines.”
- “Accumulations of events reported to a passive surveillance system do not allow incidence rate calculations due to the generally unknown extent of under-reporting as well as lack of information on the number, age, and gender of people being vaccinated.”
(vaers.hhs.gov/data.html | wonder.cdc.gov/wonder/help/vaers.html | wonder.cdc.gov/wonder/help/vaers/VAERS Technical Notes.htm)
- EudraVigilance disclaimer (excerpts): “The information on [the EudraVigilance] website does not reflect any confirmation of a potential link between the medicine and the observed effect(s). The information... concerns suspected associations that reflect the reporter’s observations and opinions. A scientific assessment of a cause-and-effect relationship between a medicine and an effect is part of the continuous monitoring of the benefits and risks of a medicine; the assessment takes into account many other factors, such as the medical condition and the medical history of the patient. [This information] relates to suspected side effects, i.e. medical events that have been observed following the use of a medicine, but which are not necessarily related to or caused by the medicine.” (adrreports.eu/en | adrreports.eu/en/disclaimer.html)
|